Tell us how much rain or snow you got! Join "CoCoRaHS"!
The Fifth National Climate Assessment
 Site-Specific Pages for [ Louisville ] [ Lexington ] [ Bowling Green ] [ Frankfort ]
View the daily climate summaries for:
[ Louisville International ] [ Louisville Bowman ] [ Lexington ] [ Bowling Green ] [ Frankfort ]
Archived Monthly and Seasonal Summaries
Climate Graphs
Maps of nationwide 1991-2020 normals, 1981-2010 normals, and the differences between the two
Comparison of local 1971-2000 normals to the 1981-2010 normals:
Annual
Seasonal
Monthly
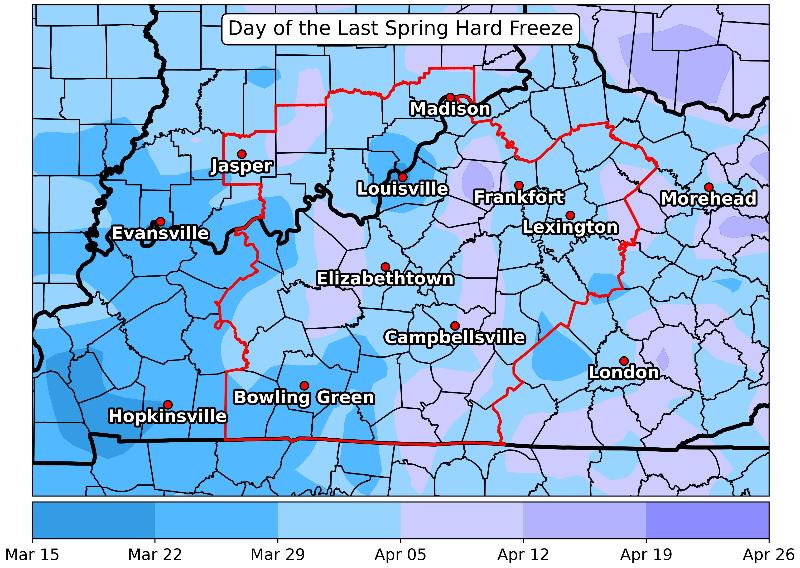
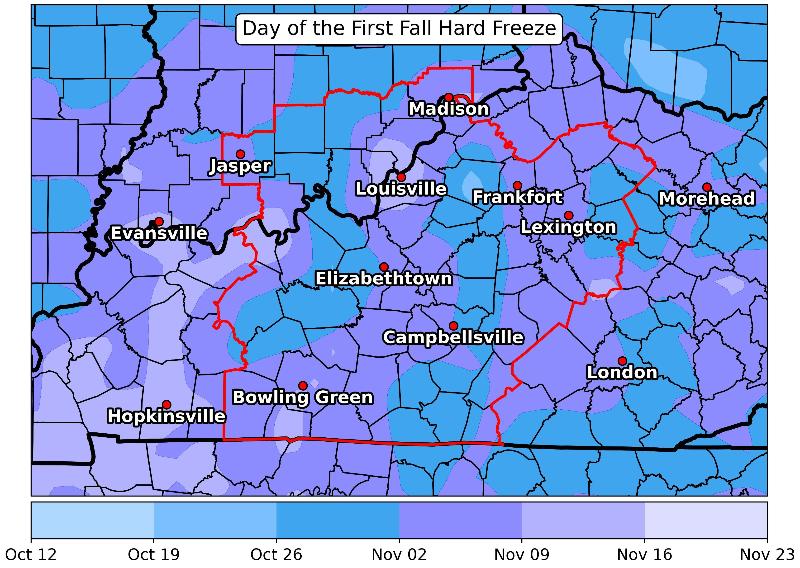
Areawide Frost/Freeze Information
Specific information for Louisville, Lexington, Bowling Green, and Frankfort.
Below is a series of maps showing average first and last dates for selected temperature thresholds (click on the maps for a larger version). These maps are for general information purposes only. For more precise information for your exact location, consult the Kentucky Climate Center or the Midwestern Regional Climate Center (MRCC). For county-level data, check out the MRCC's Freeze Date Tool.
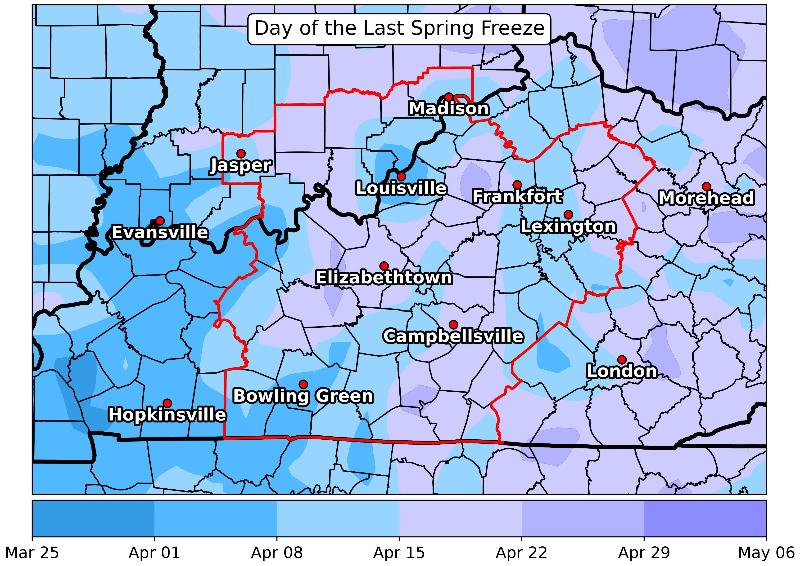
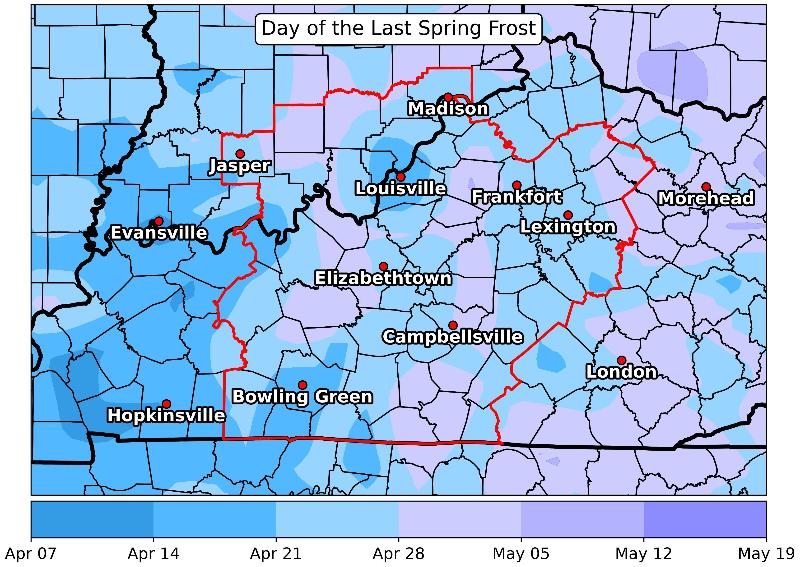
| Last 28° temperature in the spring | Last 32° temperature in the spring | Last 36° temperature in the spring |
 |
 |
 |
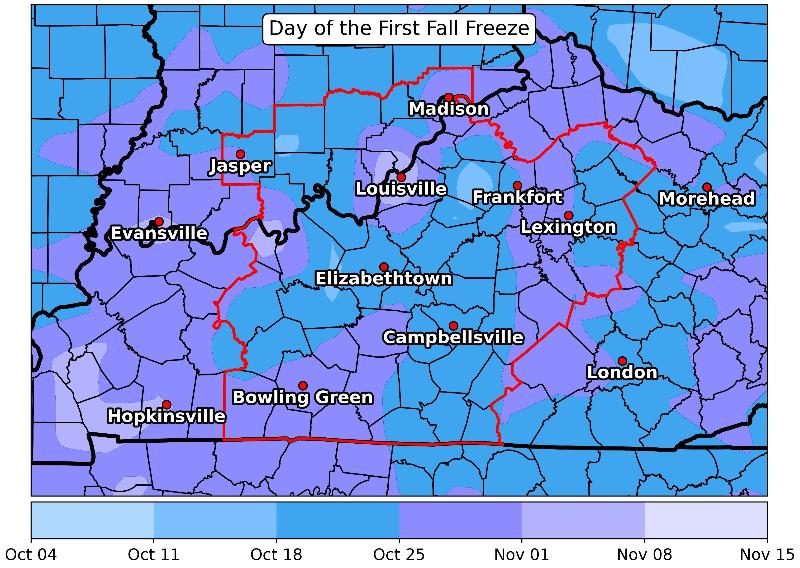
| First 36° temperature in the fall | First 32° temperature in the fall | First 28° temperature in the fall |
 |
 |
 |
If you have questions about local climate data or past observations, contact your state climatologist's office: [ Kentucky ] [ Indiana ]
Climate summaries from [2023] [2022] [2021] [2020] [2019] [2018] [2017] [2015] [2014] [2013] [2012] [ 2011 ] [ 2010 ] [ 2009 ] [ 2008 ] [ 2007 ] [ 2006 ] [ 2004 ]
Top 15 Local Weather Events of 2010-2019
Top 15 Local Weather Events of 2000-2009
Top 25 Local Weather Events of All-Time
Top 10 lists for tornado outbreaks, flash floods, floods, hail, heat, and winter events
Top 10 Events of 2010
Top 10 Events of 2011
Top 10 Events of 2012
Preliminary Local Climatological Data
The Preliminary Local Climatological Data Sheet summarizes temperature, heating and cooling degree days and precipitation and snowfall. This is preliminary unofficial data compiled within our office, and may contain erroneous or incorrect data.
Official published climatological data can be obtained from the National Centers for Environmental Information (NCEI) in Asheville, North Carolina for about 300 locations nationwide for a small charge. The data can be purchased via the Internet, for both online display, or hard-copy printout as well. Official monthly publications also contain 3-hourly weather observations for that month and an hourly summary of precipitation. Annual LCD publications contain a summary of the past calendar year as well as historical averages and extremes. Please note that Official LCDs are not available for FFT and BWG.
Official Local Climatological Data Publications for Louisville and Lexington (1929-2017)
Historical Holiday Weather
New Year's Day
Valentine's Day
Leap Day
St. Patrick's Day
Easter
Derby/Oaks/Thunder
Memorial Day
Independence Day
Labor Day
Halloween
Veterans Day
Thanksgiving
Christmas
Tornado Climatology for Central Southern Indiana and Central Kentucky
Nationwide Climatological Information
State of the Climate -- a monthly summary of the nation's climate
Climate and Astronomical Links
The highest and lowest temperature in the Lower 48 today
Learn about how climate works
2-page Quick Fact Sheets
| TEMPERATURE EXTREMES FOR KENTUCKY | |
|---|---|
| Absolute Maximum | Absolute Minimum |
| 114°F on 07/28/1930, Greensburg |
-37°F on 01/19/1994, Shelbyville |
| TEMPERATURE EXTREMES FOR INDIANA | |
| Absolute Maximum | Absolute Minimum |
|
116°F on 07/14/1936, |
-36°F on 01/19/1994, |


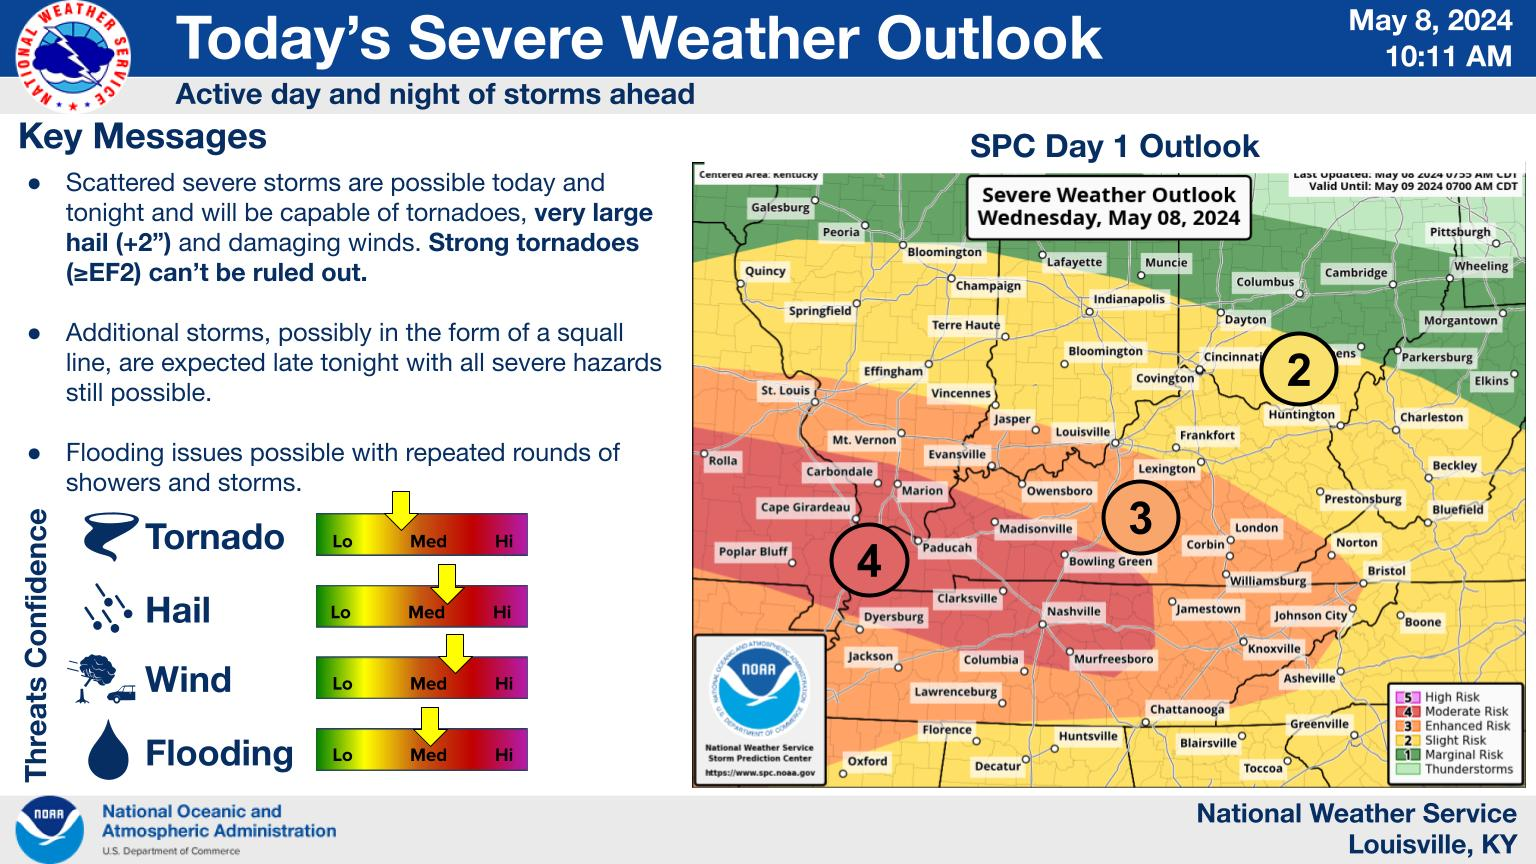 Weather Story
 Weather Map
 Local Radar
 Follow us on YouTube