NWS Cloud Chart
Back in the olden days', prior to the availability of high-resolution satellite images, the weather observer would identify the types of clouds present and estimate their height as part of his/her weather observation.
From those sky condition observations, symbols representing cloud types were plotted on weather maps where the forecaster would analyze the data to determine the location of various weather systems.
Knowing the type of cloud(s) provided vital information about the state of the atmospheric at each location. Basically, the clouds told a weather story to the meteorologist.
In 1930's, the National Weather Service standardized codes for cloud forms and state of the sky according to the international system of classification. From there, charts were created describing this state of the sky.

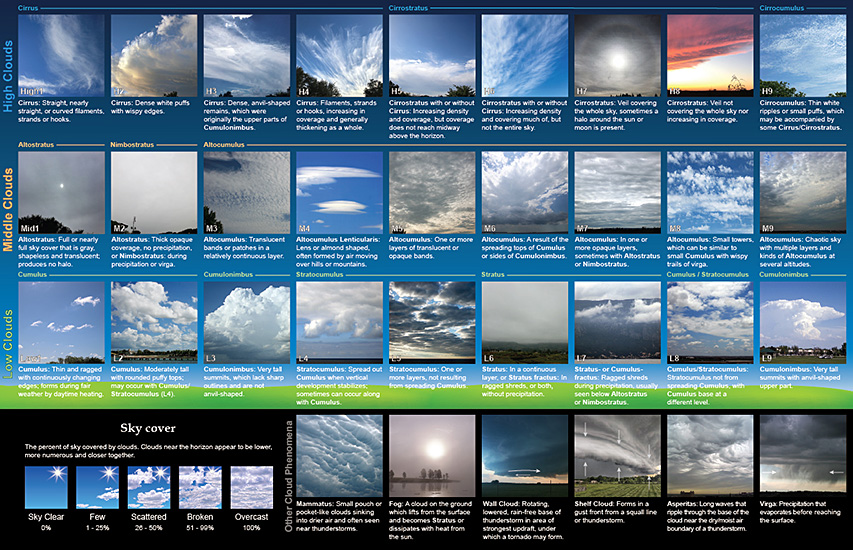
Produced in conjunction with NASA, the NWS Cloud Chart is a picture of the state of the sky. The chart displays a mixture of individual clouds and combinations of clouds. This is all to provide a picture of the state of the atmosphere at the time of observation.
For example, an overcast layer of Stratus (St) clouds mean the atmosphere is stable implying little change in the current conditions for the next few hours. Cirrostratus (Cs) that is increasing in sky coverage and thickness implies a change from fair weather to possibly rainy or snowy conditions.
Some cloud classifications on the Cloud Chart represents the same cloud type but in different stages of development or in the amount of sky cover. For example, Cumulus (Cu) clouds of little vertical extinct are classified as a 'Low 1' but are classified as 'Low 2' if there is moderate vertical growth. A Cumulonimbus (Cb) without a visible anvil is classified 'Low 3' but with an anvil it is then classified as a 'Low 9' cloud.
One thing to remember, clouds are identified based upon your observation point at your elevation. From sea-level, one might observe Altocumulus clouds over the top of a mountain. However, if you were on that mountain top and observing that same cloud you would likely report Stratocumulus. Therefore, two observers looking at the same cloud can often report different cloud classifications.
The exception to this is cumulus or cumulonimbus clouds over a mountain. Even though these low-level clouds typically have bases under 6,500 feet (2,000 meters) above ground level, if you were to observe them over a mountain top, their base might be 12,000 feet (3,600 meters) or higher relative to your location. However, over the mountain the base of those clouds would be well within 6,500 feet (2,000 meters) above ground at their location so they could still be called Cumulus or Cumulonimbus clouds seen from your location.
The Cloud Chart (below) shows examples of each of these 27 categories. By clicking an image, you will see various views of that particular cloud classification, the official description of that type and associated symbol.
Today, the 27 different cloud symbols for the 'state of the sky' are not plotted on surface maps in the United States. As weather observations became computerized in the 1990's, the automated observing systems can only detect cloud height; not cloud type. However, weather observations by humans continue in most of the world and include the 'state of the sky' using these symbols.