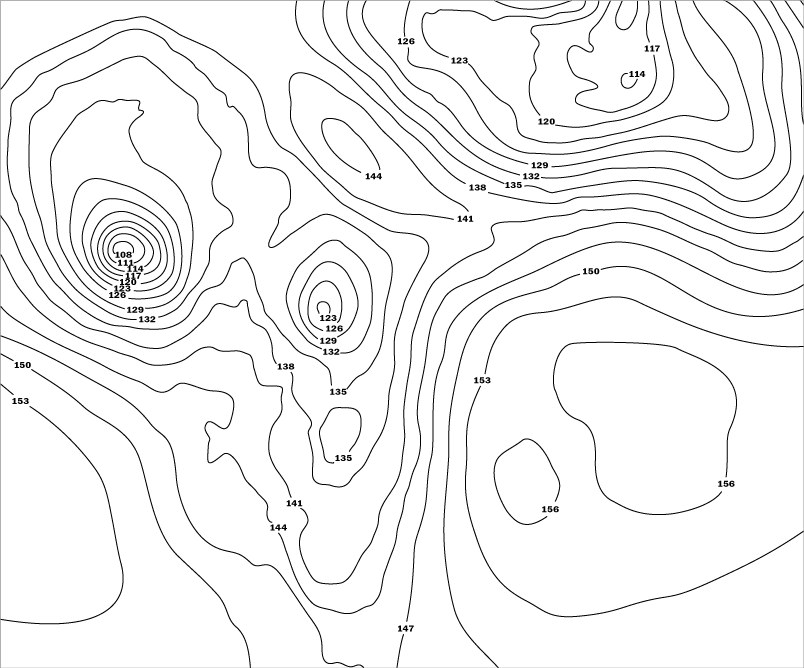
Constant Pressure Charts: 850 mb

This pressure level is near an elevation of 5,000 feet though it ranges from 3,800 feet (1,170 meters) to 5,200 feet (1,590 meters). As with all other constant pressure charts the heights are in meters with the last digit (zero) truncated. So, a height value of 132 represents 1,320 meters.
As with the 700 mb level chart, the amount of moisture is critical to precipitation forecasts. It can be provided by the relative humidity or the precipitable water value.
Precipitable water (PW) is a measure of the depth of liquid water at the surface that would result after precipitating all of the water vapor in a vertical column over a given location, usually extending from the surface to 300 mb.
PW values of 0.50" (13 mm) of less is considered very dry while values of 2" (50 mm) or greater is very moist. Some interesting aspects of weather related to PW include...
- Very unstable air masses (high CAPE) with a high PW tends to produce storms with abundant lightning.
- Thunderstorms with high PW values have a diminished the updraft velocity which in turn diminishes the size of hail stones.
- Flash flooding is more likely in thunderstorms with well above normal PW.
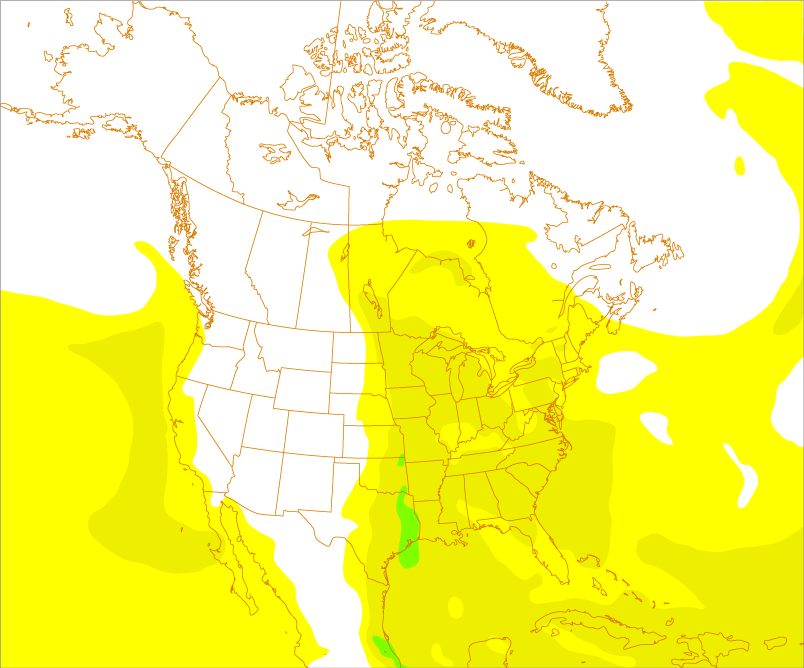
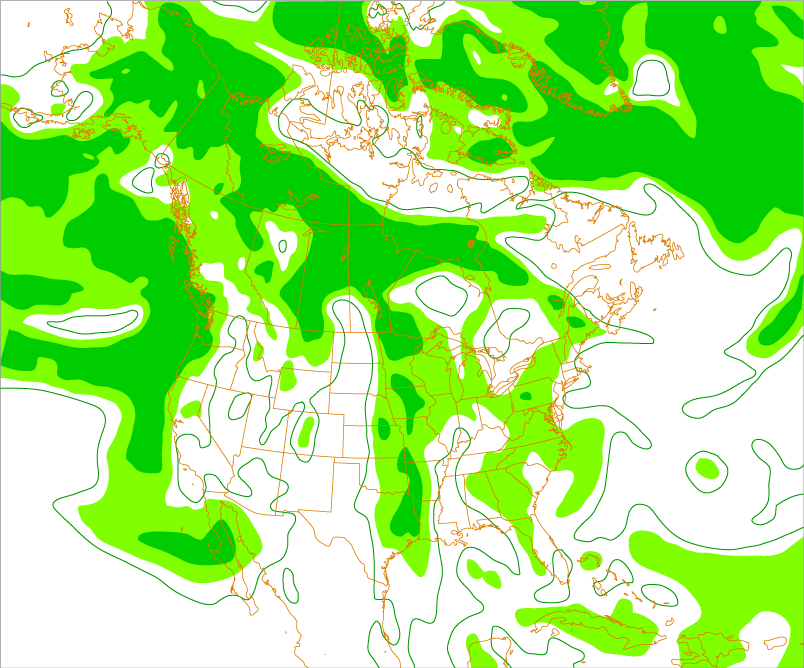
In the image below, PW's less than 0.50" (13 mm) have no color. Light yellow is 0.50" (13 mm) to 0.99" (25 mm). Dark yellow represents 1.00" to 1.49" (25 mm to 38 mm). Light green presents PW's of 1.50" (38 mm) or greater.