Indianapolis, IN
Weather Forecast Office
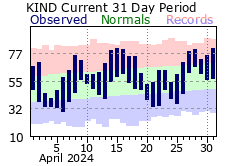
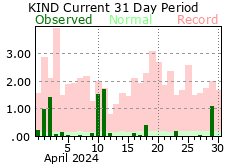
Last 31 days - Temperature: Precipitation:
 |
 |
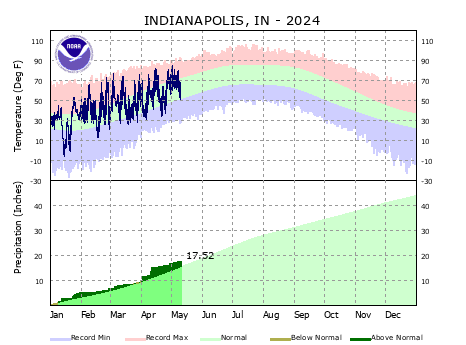
Calendar Year to date: Temperatures, Precipitation (click to enlarge)
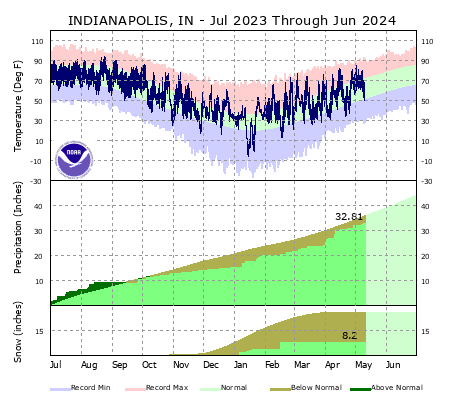
Snow Year (July-June) to date: Temperatures, Precipitation, Snowfall (click to enlarge)
Monthly Graphs for Indianapolis (available July 2007-present)
This data can also be found in text table format on our climate page. (For daily data for a month, choose "Preliminary Climatology Data (CF6)")
Choose Another Site in Central Indiana:
| Eagle Creek Airpark | Lafayette | Terre Haute | Shelbyville | Bloomington | Muncie |
Hazards
Hazardous Weather Outlook
Outdoor Event Watcher
Spotter Information
Graphical Hazards Outlook
NOAA All Hazards Radio
Drought Information
Local forecasts
Local Area
Aviation
Computer Model Forecasts
Fire Weather
Graphical
Precipitation
Air Quality
Text River Forecasts
Area Forecast Discussion
Central Indiana Weather Brief
US Dept of Commerce
National Oceanic and Atmospheric Administration
National Weather Service
Indianapolis, IN
6900 West Hanna Avenue
Indianapolis, IN 46241-9526
317-856-0664
Comments? Questions? Please Contact Us.


 Follow us on YouTube