Assessment of Methodologies to Forecast
Wind Gust Speed
Kenneth R. Cook and Bria Gruenbacher
National Weather Service, Wichita Kansas
October 20, 2008
1.0 Introduction
Wind gust prediction remains a day to day challenge for forecasters at the National Weather Service (NWS). A search of published journals yields little in the way of literature that would aid an operational forecaster in this challenge. Moreover, little operational knowledge exists on the behavior, character, or climatological occurrences of the wind gust.
In 2007, the wind gust became an official product produced by the NWS for public consumption. With the lack of applied knowledge in this area, a local research project to gain more understanding was launched to give operational forecasters some tangible science in making a forecast of the wind gust speed.
2.0 Methodology
Hourly observation data for the past 30 years from the National Climatic Data Center were gathered for sites located in 2 main study areas. The first study domain incorporated the Weather Forecast Office (WFO) Wichita's area of responsibility and included Salina (KSLN), Russell (KRSL), Hutchinson (KHUT), Wichita (KICT), and Chanute (KCNU). Approximately 1.4 million observations were studied in domain #1.
The second study domain was developed as a result of the research results from the first study area which showed promise in the ability to predict wind gusts accurately. Therefore, a large domain was studied in an effort to produce a tool that would enable better wind gust forecasts over a larger area with similar wind gust climatology and effects, with primarily influence being surface roughness (Mitsuta and Tsukamoto, 1989). This incorporated Wichita (KICT), Dodge City (KDDC), Goodland (KGLD), North Platte (KLBF), Grand Island (KGID), Omaha, (KOMA), and Topeka (KTOP). Approximately 1.6 million observations were studied in this domain.
3.0 Analysis and Results
3.1 Study Domain #1
For years, forecasters mainly relied on tools that would either multiply the sustained wind speed by a gust factor (i.e. ratio) or add a scalar value to the sustained wind speed in what is termed the difference method. Climatological study of these methods identified that a gust factor is best used for this purpose (Figure 1).
|
Fig. 1. Wind gust ratio and difference comparison for each station studied in domain 1. |
Looking at the timing of gusts, most gusts occur during the daytime. This is obvious to meteorologists given that better mixing typically occurs during the day from heating resulting in a deeper planetary boundary layer (PBL). Figure 2 shows the percentage of observations that contained a gust for each hour.
|
Fig. 2. Percent of wind gusts occurring during the specified hour for stations in domain 1. |
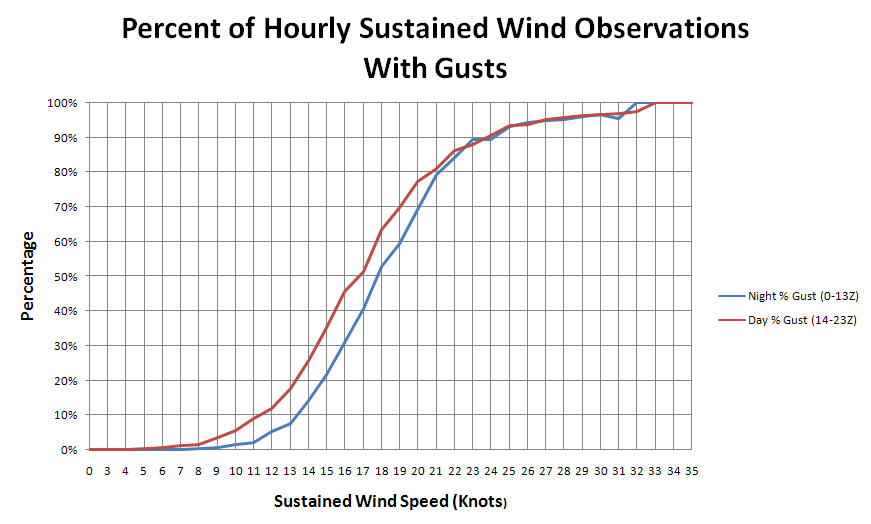
An examination of gusts which occurred at night versus day was then made. For this, a nighttime period of 00 to 13 UTC was used while a 14 to 23 UTC period was chosen for gusts which occurred during the day. On figure 3, the red curve represents the percentage of observations which contained a gust for each sustained speed during the day period. The nighttime results are in blue. Notice that not much difference exists, especially where the winds are higher. The result here led the authors to believe that it mattered little whether the wind gusts occurred during the day or night. This brings to light the theory that given windy conditions, antecedent meteorological conditions more than likely contain a well mixed PBL that would support gusts and that this theory likely increases in validity as wind speeds increase.
|
Fig. 3. The percentage of hourly observations with a gust by sustained wind speed, stratified by day and night observations. |
Thus far, we have determined when gusts, both spatially and temporally, are likely to occur. We have found that a ratio is best used to predict the wind gust from the sustained wind rather than using a difference method. To validate this, a statistical correlation was performed (not shown) using a 4th order polynomial regression. The correlation coefficient (R^2) was found to be .996 or 99.6 percent of the variance explained, an excellent result. Given this result, we then pursued probabilistic results for forecasting a 10 percent probability of exceedance (POE) for the wind gust.
To do this, the number of observations that contained a gust were recorded for each sustained wind speed. The wind gust that occurred at the 90th percentile was then recorded. These were then stratified by day and night observations. Figure 4 shows the result, virtually no difference.
|
Fig. 4. Wind gusts occurring at the 90th percentile stratified by day and night observations. |
A statistical correlation was again performed on these data utilizing a 4th order polynomial regression (not shown). The results were excellent with the correlation coefficient (R^2) being .997 or 99.7 percent of the variance explained. Confidence was high that a wind gust, be it either an average or a 90th percentile wind gust, could therefore be predicted with a high level of accuracy for a given sustained wind speed.
3.2 Study Domain #2
Given the high level of confidence given the result found in study domain 1, the same methods were then applied to study domain 2. This domain was chosen for study to increase forecast consistency for a given region that has similar surface roughness and therefore should exhibit similar results (Paulsen and Schroeder, 2005).
To test this, a comparison was made between KGLD and KCNU. These sites were chosen as they would yield the greatest difference in resultant wind gust speeds. Data analysis (not shown) yielded that differences in wind gust speeds were on the order of 5 percent. Therefore, for given sustained wind speeds of 20 knots, the wind gusts at KGLD would average about 1 knot higher than those at KCNU. This difference was deemed insignificant given the nature of the wind gust itself where a one knot difference would fall within the "noise" of the wind gust data.
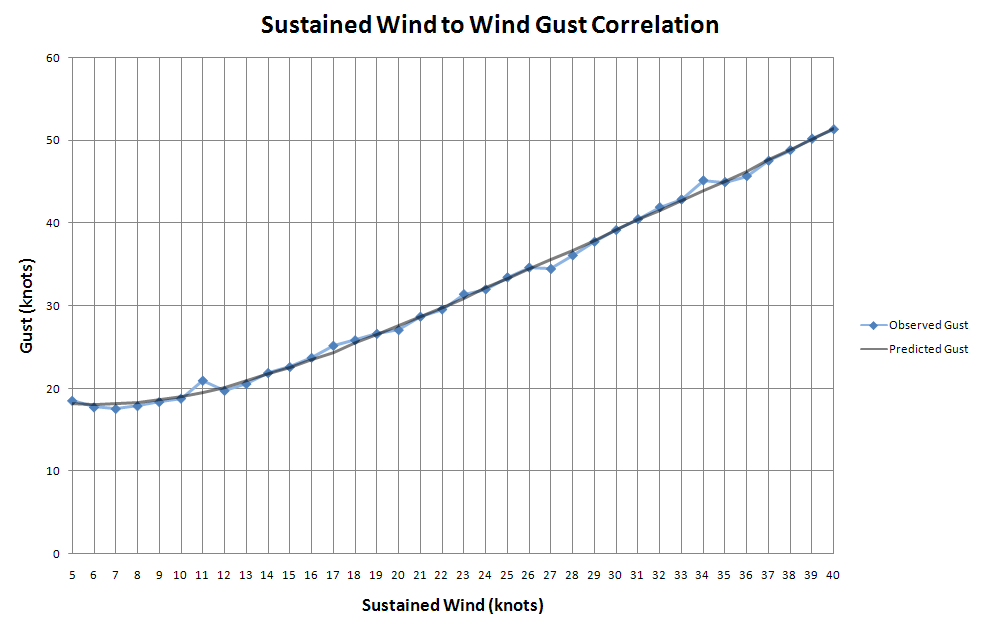
Proceeding with the knowledge in hand from the previous study domain, a correlation was performed for the sites in study domain 2. The results are shown in figure 5. Note that the correlation coefficient (R^2) was again very high at .995 or 99.5 percent of the variance explained. This suggests a very high predictability when using the sustained wind to forecast a wind gust.
|
Fig. 5. Correlation of the sustained wind to predict the wind gust. |
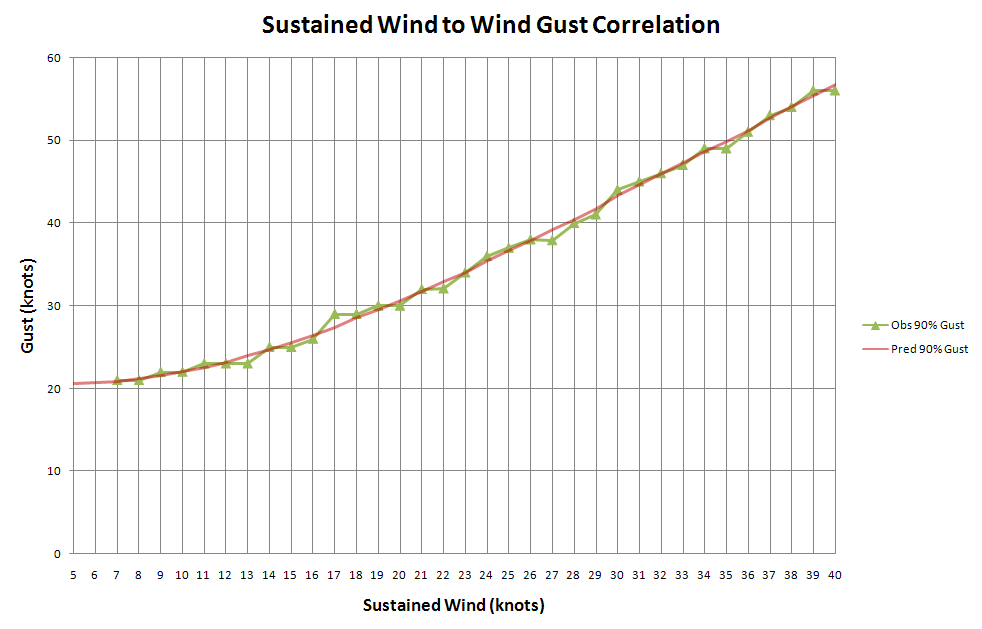
Further, the 90th percentile gust data was examined with a statistical correlation completed to forecast a 10 percent POE wind gust from the sustained wind. The correlation coefficient (R^2) was again very high at .996, or 99.6 percent of the variance explained. This implies a very high level of predictability. Figure 6 illustrates this.
|
Fig. 6. Correlation of the sustained wind to predict the 90th percentile wind gust. |
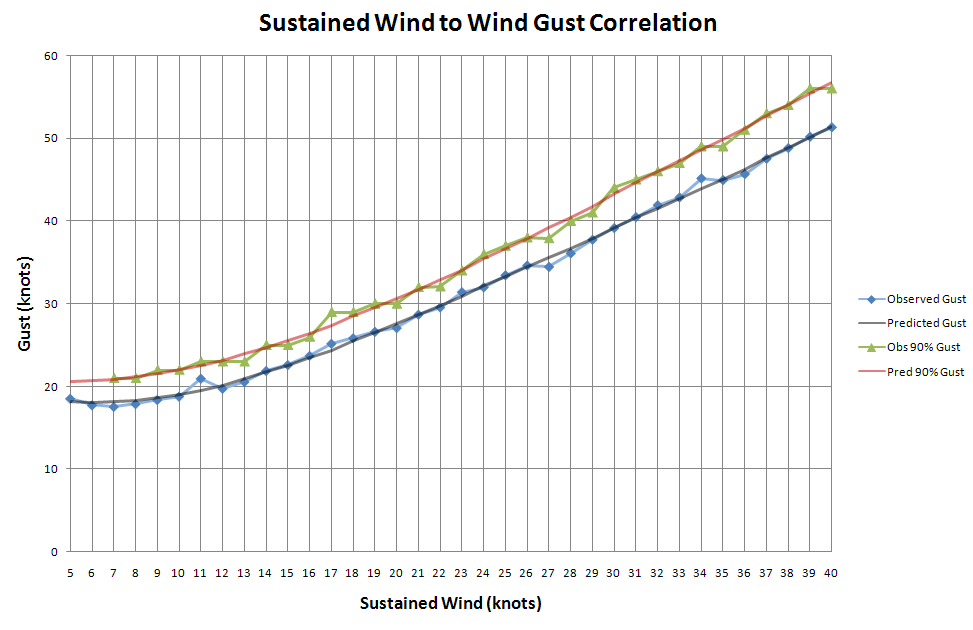
Figure 7 shows these two results on the same graph so that the viewer can examine the slight differences in the average and 90th percentile gusts.
|
Fig. 7. Graphs of both results shown in figures 5 and 6. |
4.0 Summary and Conclusions
Wind gust speed forecasts have been a great challenge over the past years, mainly due to the lack of knowledge of the behavior and character of them. This study was done to develop the science and statistics to make an accurate wind gust speed forecast.
It was found that using a gust factor was best in forecasting wind gust speeds. This is in agreement with previous work done on wind gust speed forecasting by Mitsuta and Tsukamoto in 1989 and Paulsen and Schroeder in 2005. When comparing the percentage of gusts that occurred for a given sustained wind speed stratified by day and night, little difference was found. In fact, the difference decreased as the sustained wind speeds increased so that no difference was noted above 20 knots of sustained wind. This likely proves the theory that as the sustained wind speed increases, so does the likelihood that a mixed PBL exists.
These results allowed for correlations to be made using the sustained wind speed as a predictor of wind gust speed. These were done for both the average wind gust speeds and the 90th percentile wind gust speeds. Results for both study domains 1 and 2 showed a very high level of correlation, with 99.5 and 99.6 percent of the variance being explained for the average and 90th percentile wind gust speeds. This shows great promise in using this method to predict wind gust speed from the sustained wind speed.
5.0 References
Mitsuta, Y., and O. Tsukamoto, 1989: Studies on Spatial Structure of Wind Gust. J. Appl. Meteor., 28, 1155–1160.
Paulsen, B.M., and J.L. Schroeder, 2005: An Examination of Tropical and Extratropical Gust Factors and the Associated Wind Speed Histograms. J. Appl. Meteor., 44, 270–280.


 Follow us on YouTube