Ascertaining Changes in Extreme Temperature Occurrences in Central, South-central, and Southeast Kansas
Kenneth R. Cook and Chris Wiebe
National Weather Service, Wichita Kansas
May 15, 2008
1.0 Introduction
Climate change is a big topic and challenge in our world today. A significant number of customer service calls and presentation requests received by the National Weather Service in Wichita are related to this very topic. Interest locally in investigating how the local climate has changed with regard to extremes in maximum and minimum temperatures prompted this study. This document will attempt to illustrate these changes using a significant amount of data across our area of responsibility.
2.0 Methodology
Observation sites used were identified by length and completeness of station record. This station record needed to originate no later than Midnight 01 January 1930 and remain continuous through 11:00 PM 31 December 2007. It was imperative during this study to include the decade of the 1930's, given the amount of drought and extreme heat during those years, to give the authors some insight as to how these extremes in temperature compare to today's. Tables 1 and 2 list the stations that met the above criteria for maximum and minimum temperature respectively and were therefore used in this study.
|
|
For the purpose of this study, extreme heat was defined as maximum temperatures reaching or exceeding 100 degrees Fahrenheit. Extreme cold was defined as a minimum temperature of zero degrees Fahrenheit or below. From the stations used, a total of 14,629 cases of extreme heat were identified and 3568 cases of extreme cold.
3.0 Results and Discussion
| Analysis of these data brought some surprising results. For the maximum temperatures, the decades of the 1930's and 1950's clearly present themselves as the warmest decades for the stations studied. The decade with the least number of occurrences is the 1990's. In fact, one could argue that there has been a general decrease in the number of these occurrences overall through the last 80 years. |  |
| At right is the analysis of the individual station data. Decades are color coded from the highest number of cases (red) to the lowest number of cases (light purple) using the results from the decadal number of occurrences. | 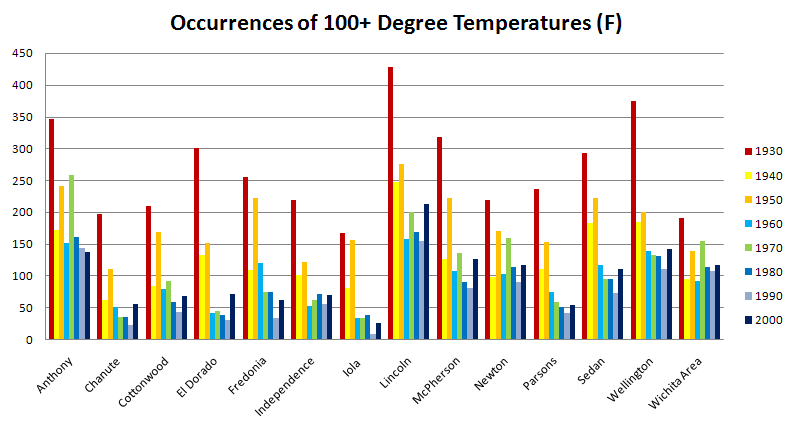 |
| At right are the results for the occurrences of zero or below minimum temperatures for the last 80 years by decade. Notice the high number of cases during the 1970's and 1980's. There has been a recent drop off over the last 20 years. |  |
| Here are the individual station data for the last 8 decades. These decades are color coded by the highest number of cases (purple) to the lowest (red) using the results from the decadal number of occurrences. |  |


 Follow us on YouTube