|
Assessment of BUFKIT Methodologies to Forecast Kenneth R. Cook and L. David Williams September 11, 2007, updated Septemer 19, 2012
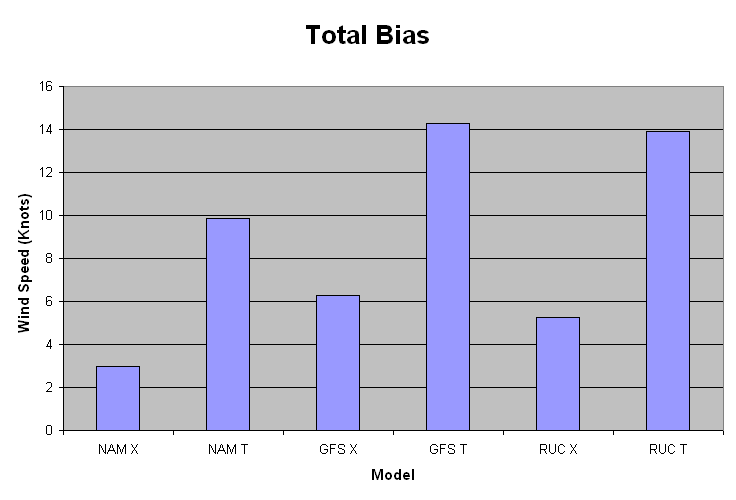
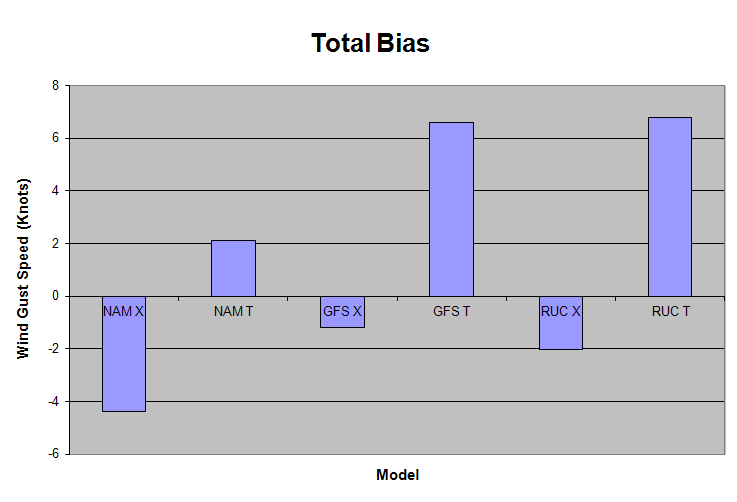
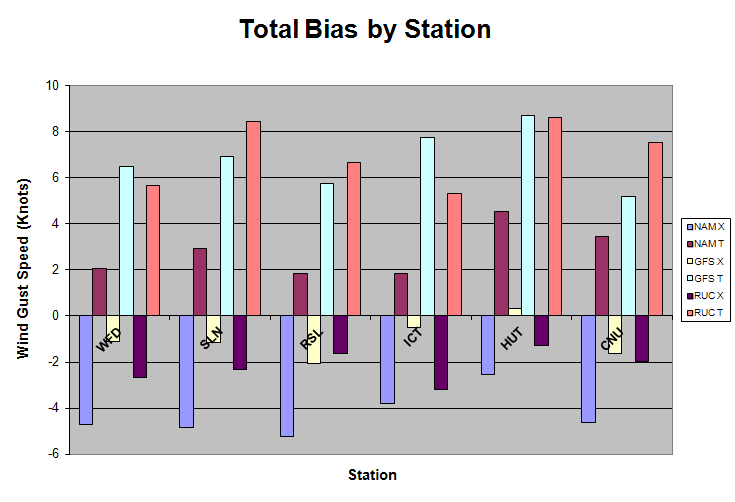
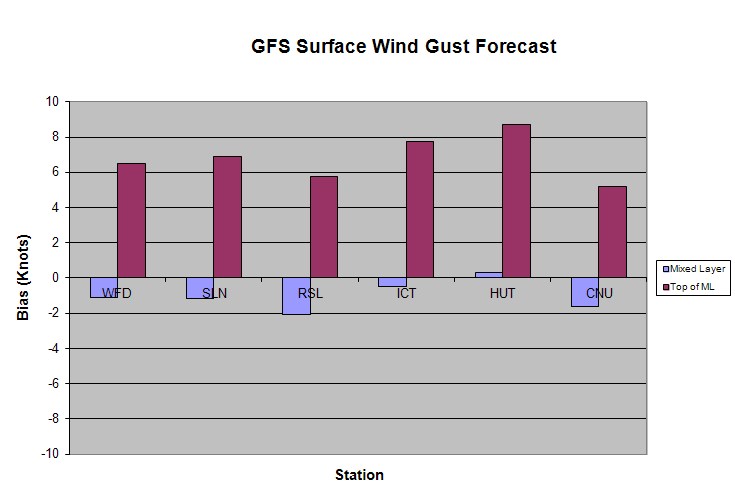
1.0 Introduction Wind and wind gust forecasts remain a day to day challenge for forecasters at the National Weather Service (NWS). Winds produced by synoptic scale pressure gradient forces, commonly referred to as gradient winds, consist of a large part of this challenge, especially in the fall, winter, and spring months on the Plains. BUFKIT (WTDB, 2007) is one of the primary software packages used to assess the environment and produce wind forecasts by forecasters. It would only be prudent to investigate the accuracy of using such software and determine what "best practices" can be utilized to improve said forecasts. 2.0 Methodology Hourly observation data from the National Climatic Data Center were gathered for 6 sites across the Weather Forecast Office (WFO) Wichita's area of responsibility. Specifically this included Salina (SLN), Russell (RSL), Hutchinson (HUT), Wichita (ICT), Chanute (CNU), and Winfield (WLD). The dates examined consisted of the 6 month period from January through June of 2006. This corresponded to the locally available BUFKIT data archive. Cases were identified by looking at Wind Advisory and High Wind Warning Cases for the WFO ICT service area. This amounted to in excess of 20 cases for the said time period as the spring of 2006 was quite windy. In fact, 19 wind advisories were issued during the spring months of 2006 alone. Once cases were identified, hourly wind and wind gust observations were matched with the hourly forecasts of mixed layer winds (referred to in the images below as the model name -X (e.g. NAM-X)), or in BUFKIT "momentum transport winds", and wind speed at the top of the mixed layer (referred to in the images below as the model name -T (e.g. NAM-T)). For this study, these fields were used as a proxy for a surface wind forecast in a well mixed atmosphere as this can be common practice by operational forecasters. The goal is to ascertain the validity in making such an assumption and to determine the most accurate way to forecast a sustained wind and a wind gust. The NAM-Eta, GFS, and RUC models were used for this evaluation as the model forecasts in BUFKIT. Only the 0-6 hour forecast time period was assessed as this would, in theory, produce the most accurate forecasts of any model element (Zhu, 2007). Once the data were assessed, graphs were produced showing a plethora of statistical analysis. Additionally, errors were placed into "bins" in order to further assess the level of accuracy. 3.0 Analysis and Results Below are various graphs showing some of the results of this study, using the mixed layer wind (hereafter MLWIND) and wind speed at the top of the mixed layer (hereafter TMLWIND) directly as a proxy for a surface wind forecast.
4.0 Summary and Conclusions Forecasters use BUFKIT as an integral part of the forecast process. High wind cases were examined to ascertain the validity of using said software, developing best practices from this research to forecast sustained wind and wind gust speed. MLWIND and TMLWIND were used as a proxy for a surface wind speed forecast in a well mixed atmosphere. Sustained wind speed was not predicted very well overall as a significant bias to over forecast surface wind speed was noted. However, MLWIND showed the most promise as a method using the NAM forecast where a bias of nearly 3 knots was found to exist. This bias must be taken into consideration while making this forecast. Secondly, the ability to forecast wind gust speed using this same methodology proved fruitful. Both the GFS and RUC MLWIND forecasts were quite accurate for the cases studied. Examination of the RUC showed a bias of -2.02 knots. Evaluation of the GFS produced a bias of -1.19 knots. Additionally, the NAM TMLWIND produced a bias of 2.13 knots. From these data, forecasters could deduce that using the GFS or RUC MLWIND forecast as an approximation of an observed surface wind gust speed in a gradient wind environment, taking into consideration the TMLWIND of the NAM would be deemed appropriate. Finally, it can be concluded that using the momentum transport winds in BUFKIT to predict a surface wind and wind gust speed is a great asset to the forecasters. This software should be utilized as much as possible to facilitate improved surface wind and wind gust speed forecasts. 5.0 References Warning Decision and Training Branch (WDTB), 2007: BUFKIT information available at the following web site: https://wdtb.noaa.gov/tools/BUFKIT/index.html. AvnFPS, 2007: Wind Rose Calculations from data 1973-2004. Zhu, Yuejian, 2007: Verification data from the Environmental Modeling Center (EMC) available online at https://www.emc.ncep.noaa.gov. |


 Follow us on YouTube