


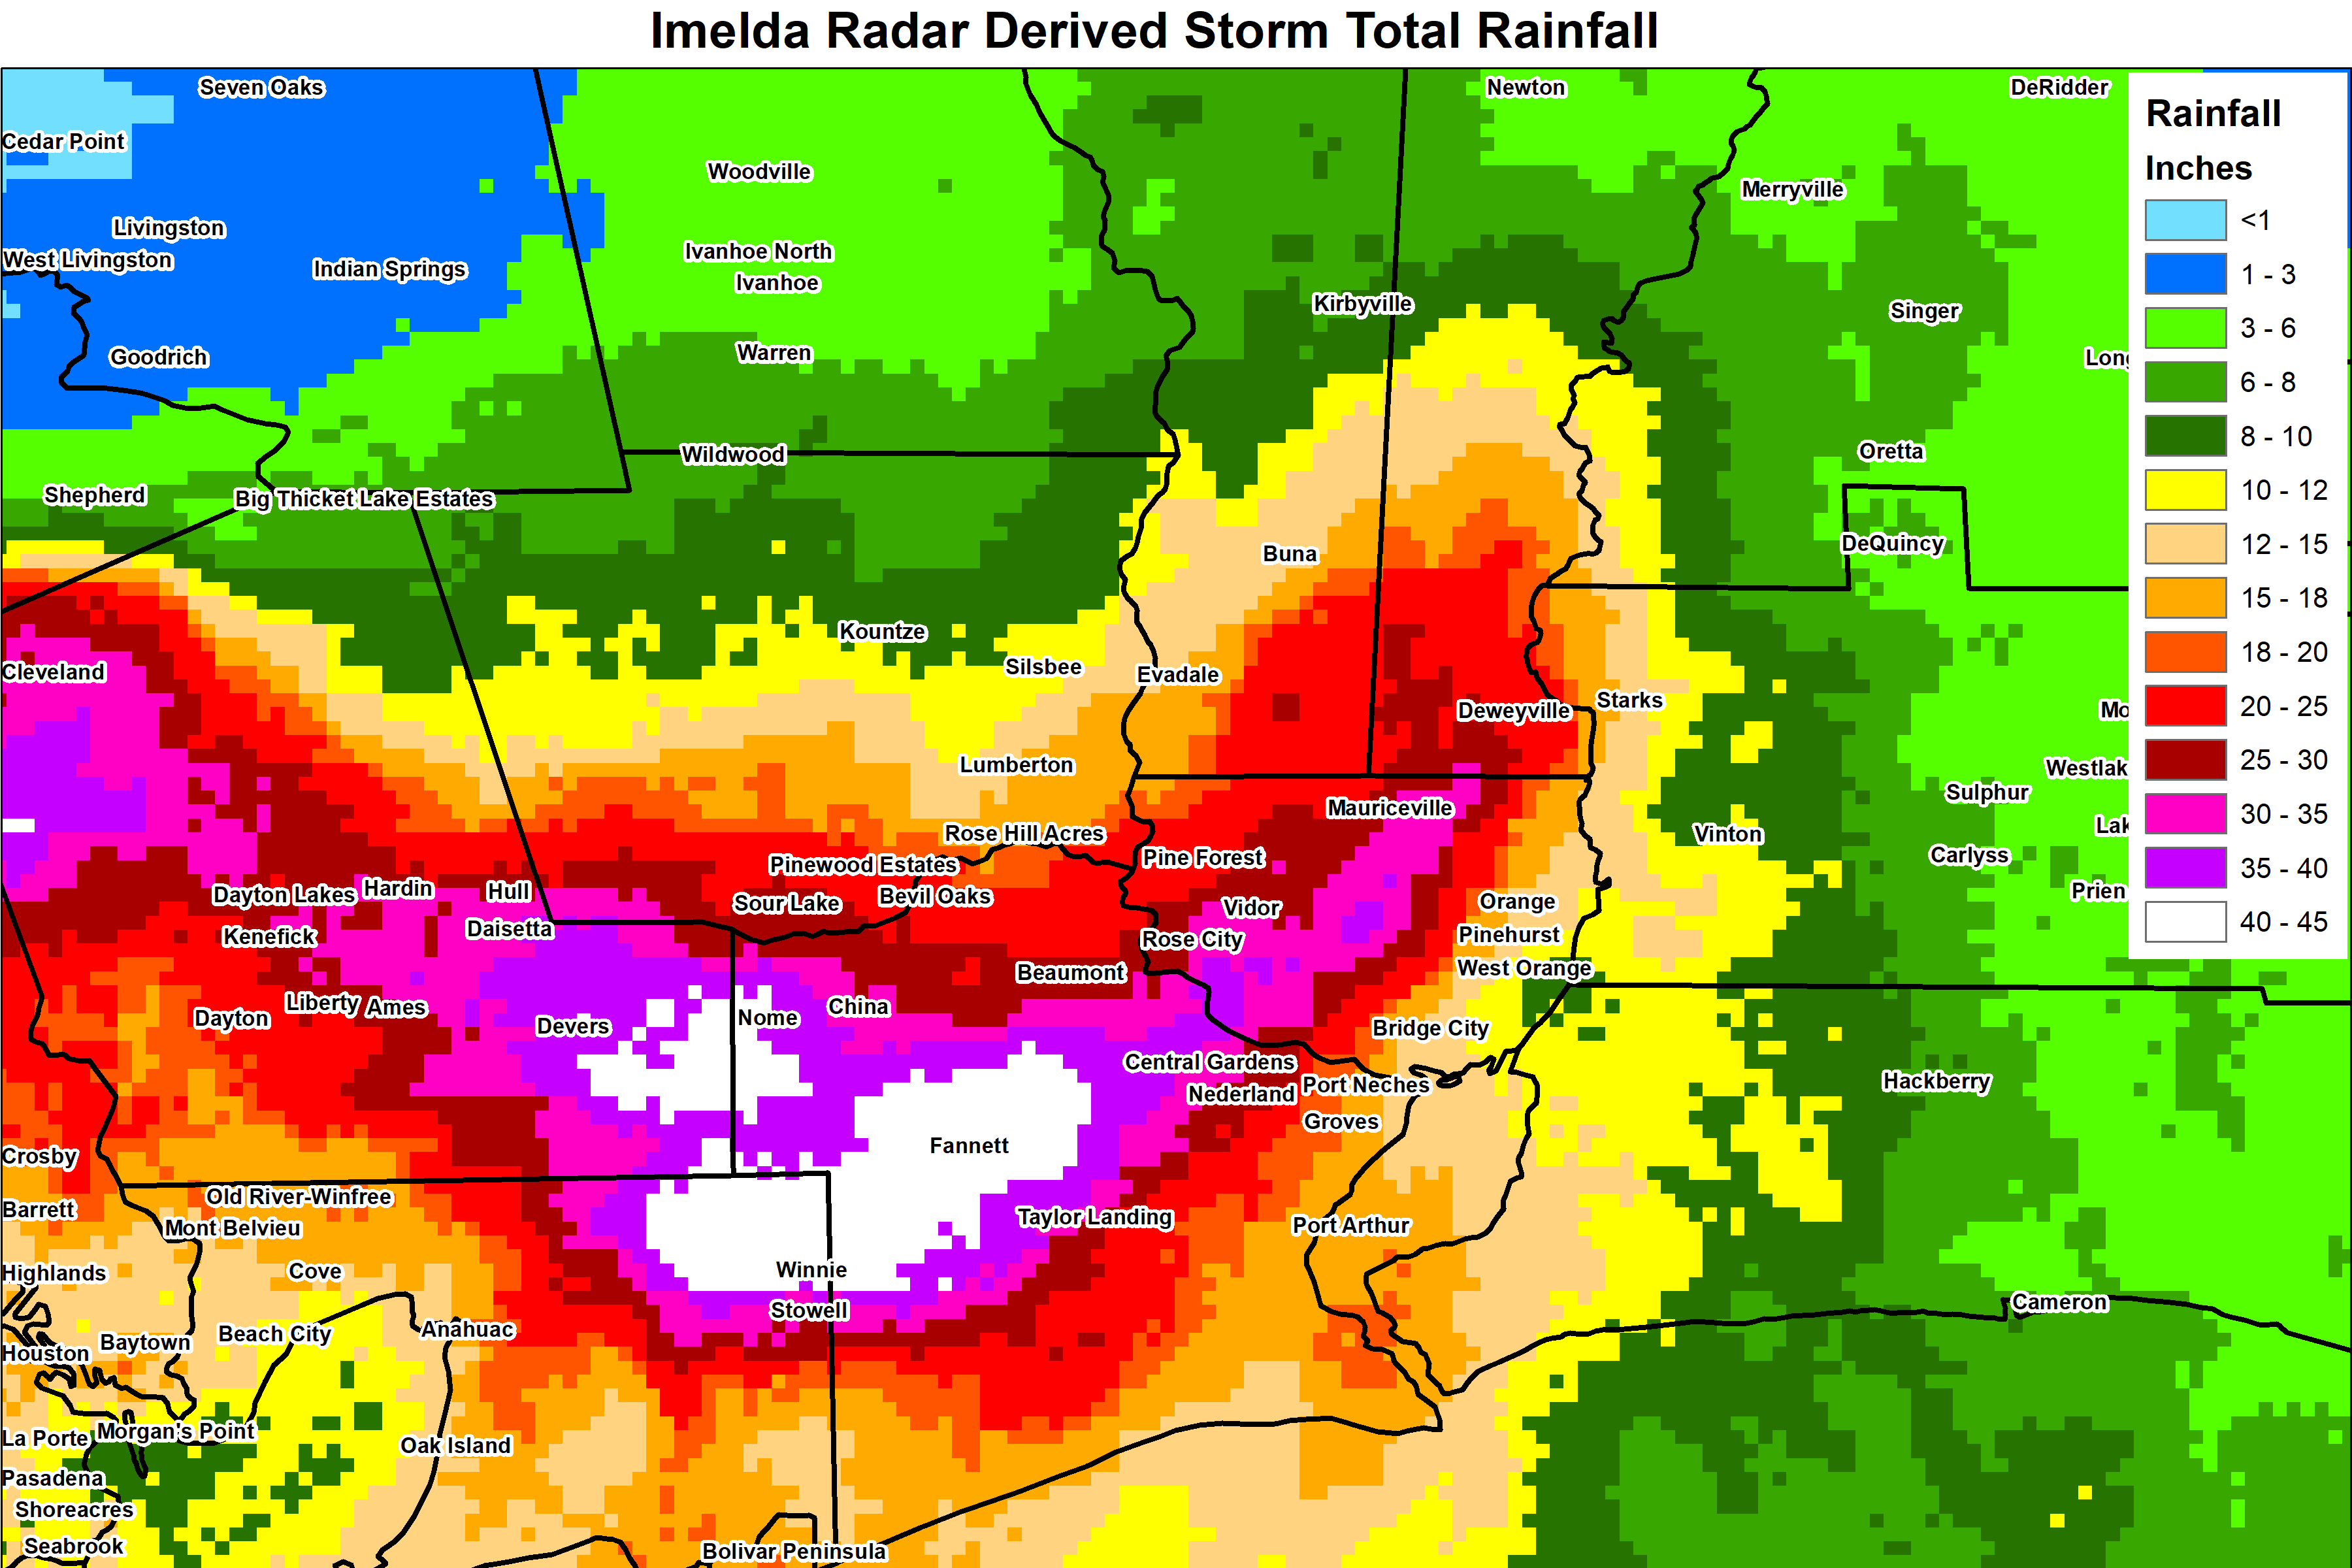
Imelda was a short-lived tropical storm that moved inland near Freeport, Texas just after it developed in the late morning through early afternoon hours on September 17th. Maximum winds at landfall were 40 mph, and the minimum central pressure was 1005 mb. The system and its remnants meandered inland for a couple of days after landfall and produced historic rainfall totals and devastating flooding over portions of Southeastern Texas. As the system stalled across Southeast Texas, significant convection developed with a feeder band southwest of the center the evening of the 17th into the morning of the 18th, with significant flooding across Galveston to Houston. Another significant feeder band developed south of the center across Southeast Texas the afternoon of the 18th into the 19th. The orientation of this rain band provided continuous training of thunderstorms across Southeast Texas, with devastating flooding along the I-10 corridor from Winnie eastward to Fannett, Beaumont, Vidor, and Orange Texas. This area accumulated 30 to 44 inches of rainfall during the storm, with the greatest total of 44.29 inches recorded 2 miles south-southwest of Fannett, TX. Also noteworthy about the Fannett, TX total was 31 inches fell in 12 hours. During the height of the flooding, numerous vehicles were either stuck or flooded on I-10 between Beaumont and Winnie for 2 ½ days. Storm totals exceeded 30 inches in just three days over southeast Montgomery, northeast Harris and Chambers counties.
Imelda broke several rainfall records in the United States. As of 2/1/20, Imelda is currently the 7th wettest tropical cyclone to impact the United States, the 5th wettest in the contiguous United States and the 4th wettest in Texas.
Here is our Post Tropical Cyclone Report on Imelda.
Here is Imelda's rainfall data, courtesy of the National Weather Service's Weather Prediction Center.
More detailed information on Imelda (including radar and satellite loops) is available in the Lake Charles National Weather Service Office's Imelda page.
Here is the National Hurricane Center's Tropical Cyclone Report on Imelda.
Imelda placed second in Top 10 Weather Events of the 2010s.
Harvey (Hurricane - August 25th landfall)


Harvey was a long-lived tropical cyclone that formed east of the Lesser Antilles on August 17th. Over the course of about a week, Harvey traversed the Lesser Antilles, Caribbean Sea, and Yucatan Peninsula as a tropical storm and tropical depression. Once the system moved into Bay of Campeche on August 23rd the storm encountered favorable conditions for rapid development — warm sea surface temperature and low wind shear. As the storm moved to the northwest it quickly strengthened to tropical storm and then hurricane strength on August 24th. On the 25th Harvey continued to rapidly intensified to a category 4 hurricane with maximum sustained winds of 130 mph and a central minimum pressure of 937 mb. Late in the day on the 25th Harvey made landfall near Rockport, Texas at peak intensity. After making landfall, the system moved very slowly before meandering back off shore on August 28th as a tropical storm. On August 29th Harvey made another landfall near the Texas/Louisiana border as a strong tropical storm. Harvey weakened to a remnant low on September 1st as it moved into the Lower Mississippi Valley.
Harvey was noteworthy for several reasons. Hurricane Harvey was the first major hurricane to make landfall in the U.S. since Hurricane Wilma in 2005, ending a record-long 12-year streak of no major hurricanes hitting the United States. The slow moving nature of the storm dropped torrential rainfall across northeastern Texas and southwestern Louisiana. The hardest hit areas included the Houston, Beaumont, and Port Arthur areas of Texas. Many locations received over three feet of rain over the five-days that Harvey slowly moved through the region with precipitation totals over 40 inches common and a few isolated totals of 50 inches or more. Pending final review, these precipitation totals in excess of 50 inches will surpass the 5-day and tropical storm related precipitation totals for the contiguous United States. The Houston NWS Weather Forecast Office received 43.38 inches of rain, the highest 5-day precipitation total on record for any major U.S. city. The heavy rains led to unprecedented flooding in Houston and surrounding areas. Tens of thousands of people were displaced due to flood waters with thousands of homes and businesses destroyed. At least 70 fatalities were blamed on the storm and Harvey will likely rank among the costliest natural disasters to ever impact the nation.
Here is the Service Assessment Report on Hurricane Harvey from DOC/NOAA/NWS.
Here is the National Hurricane Center's Tropical Cyclone Report.
Here is the West Gulf River Forecast Center's ArcGIS Storymap.
Here is the Weather Prediction Center's (WPC) Hurricane Harvey Page.
Here is the final report from Harris County on Hurricane Harvey - Storm and Flood Information.
Here is a Harvey webpage from NASA.
Here is our Harvey Webpage and our most recent Post Tropical Cyclone Report.
Here are Hurricane Harvey websites from National Weather Service Offices in Corpus Christi and Lake Charles.
Harvey placed first in Top 10 Weather Events of the 2010s.


Cindy made landfall as a tropical storm in southwestern Louisiana between Port Arthur, TX and Cameron, LA in the early morning hours of June 22nd. Cindy's main impact was minor coastal flooding around Galveston Island and especially the Bolivar Peninsula. Storm total rainfall ranged from around one quarter inch at Houston Intercontinental Airport to 4.33 inches on the Bolivar Peninsula with the highest amounts generally across Chambers, Galveston and Liberty counties as well as the Bolivar Peninsula. The highest sustained wind of 37 knots (43 mph) was recorded at WeatherFlow site KCRB on the Bolivar Peninsula and the peak gust of 45 knots (52 mph) was recorded at Rollover Pass on the Bolivar Peninsula. The lowest sea-level pressure was 999 mb at Galveston Scholes Field. Minor coastal flooding was the tropical storm's main impact. Despite predominant offshore winds, long period swells and associated wave run up led to a rise in water levels along Gulf facing beaches. In addition, a persistent northerly wind component lead to a pile up of water on north facing Bay side beaches. Water and debris covered a low lying section of Highway 87 near its intersection with Highway 124 which is an area that is especially vulnerable to coastal flooding. Elsewhere, channels were elevated around Jamaica Beach and other west end communities of Galveston Island, but there was little impact. Minor coastal flooding was also experienced around Surfside and Blue Water Highway in Brazoria County.
Here is our Post Tropical Cyclone Report on Cindy.
Here is Cindy's rainfall rainfall data, courtesy of the National Weather Service's Weather Prediction Center.
More detailed information on Cindy is available in the Lake Charles National Weather Service Office's Cindy page.
Here is the National Hurricane Center's Tropical Cyclone Report on Cindy.


Bill made landfall across Matagorda Island on the morning of June 16th. Strong winds and minor coastal flooding occurred near Matagorda Bay in Jackson County. Heavy rainfall of over 13 inches caused significant inland flooding in and around the towns of Lolita, Edna, and Ganado. The maximum sustained wind gust reported in Matagorda Bay was 45 knots (52 mph). Bill's maximum wind gust of 54 knots (62 mph) was reported on the Bolivar Peninsula at Crab Lake. There were no reported tornadoes.
Storm surge heights ranged from 2.1 feet in Chambers County to 3.2 feet in Galveston County. Roads were flooded and closed around Sargent in Matagorda County. Flood waters rose around homes in the city of Matagorda, but no damage was reported. In Brazoria County, surge flooded impacted Surfside beaches, the Treasure Island subdivision and San Luis Pass Park. In the village of Surfside Beach, Seashell, Surf and Beach Roads were closed due to high water form storm surge. All countywide beach access roads were closed. Storm surge flooding was two feet deep in the Treasure Island subdivision. Heavy rain caused the flooding of Chocolate and Halls Bayous. There were four trees that were downed by wind. There was minor coastal flooding on the Bolivar Peninsula in Galveston County with some debris removal required off of State Highway 87. High surf caused erosion of Galveston Island beaches. Sand and debris washed up on the streets of various west end island communities. There was minor flooding damage to downstairs garages in Jamaica Beach with two temporarily closed roads. in Harris County, there was minor storm surge flooding in Shoreacres, Clear Lake Shores, and along Toddville Road in Seabrook. Two feet of water impacted Shoreacres when Taylor Bayou came out of banks. Parks in Nassau Bay also experienced minor storm surge flooding. in Chambers County, there were low lying rural roads that experienced minor coastal flooding. High rainfall occurred near the core of Bill and also within its outer bands that tapped into higher moisture that feed back into the tropical storm. This high rainfall caused inland flooding. Storm total rainfall ranged from 1.38 inches in San Jacinto County to 13.78 inches in Ganado (Jackson County). In Jackson County, FM 1593 west of La Ward and State Highway 59 from Edna to the Wharton County line were closed. Flash flooding in Washington County caused road closures in the town of Brenham early in the morning of the 17th. In Grimes County, numerous roads were closed including FM 3090 north of Navasota and FM 1774 north of Plantersville. In Wharton County, several roads were closed in El Campo. In Colorado County, numerous roads were closed including FM 2761, FM 2434, and FM 532. In Houston County, Highway 287 near Crockett and SH 19 between Crockett and Lovelady were closed. In Walker County, there were ten county roads and a state highway that were flooded.
National Hurricane Center:
Weather Prediction Center:
Post Tropical Cyclone Reports:
An interactive track map of Bill can be found here.
A radar loop of Bill can be found here.


 Follow us on YouTube