National Weather Service United States Department of Commerce

Unprecedented Extended Wet Period across Hawaii - February 19 to April 2, 2006

Andy Nash, Nezette Rydell and Kevin Kodama

Updated: May 11, 2006

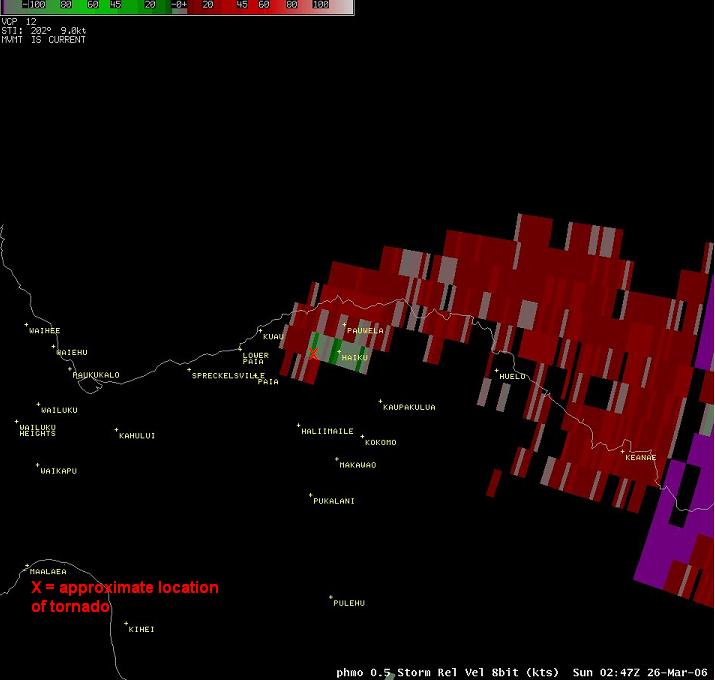
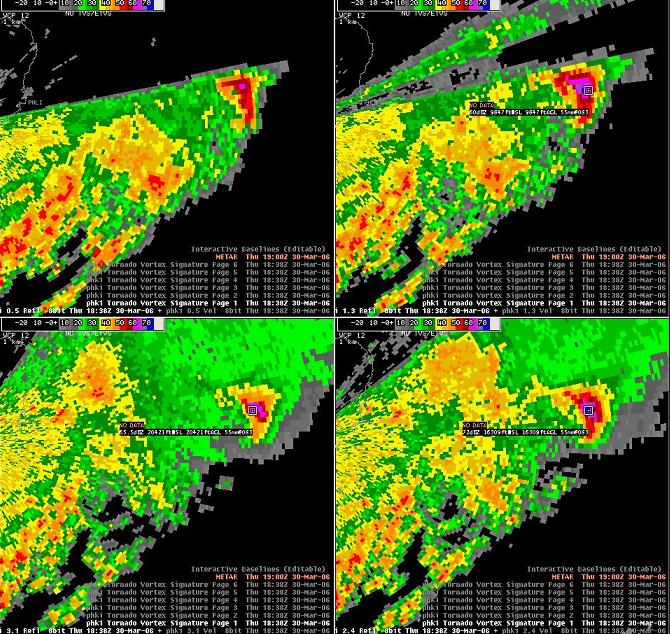
New satellite loops, rainfall analysis charts, radar images of storms on March 23,24,25,27 plus photos of the March 25 Maui tornado


Summary:

The winter wet season of 2005-2006 started off extremely dry across Hawaii as a strong jet stream persisted across the north Pacific, keeping all significant rain makers well to our north. December 2005 was the driest December on record for Lihue, with only 0.08 inches (normal is 4.8 inches). Even normally wet Mt Waialeale on Kauai received only 1.67 inches (normal is over 45 inches).


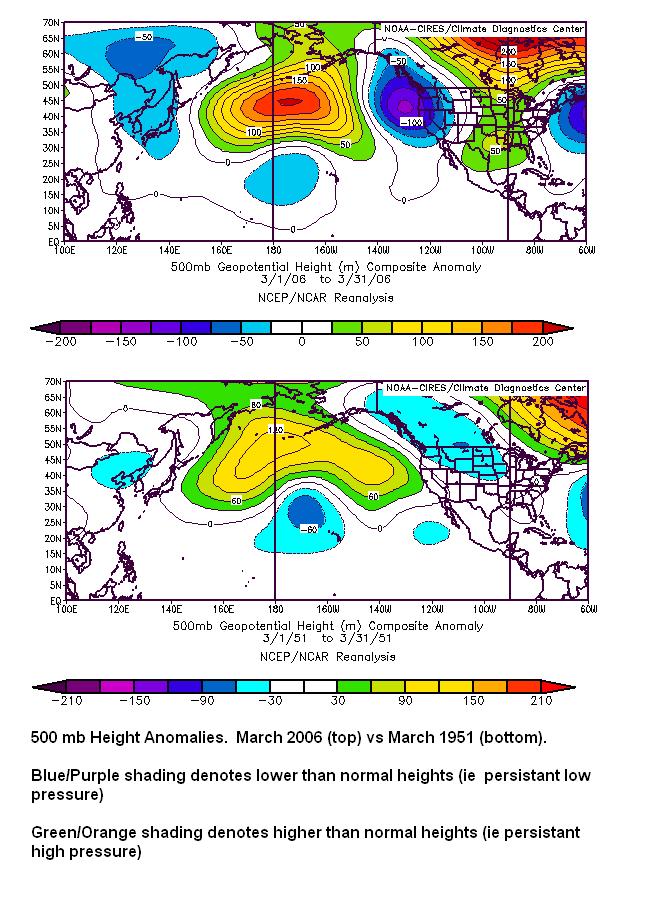
This pattern broke down in early February as the jet stream across the Pacific weakened, likely in concert with a developing weak La Nina pattern, and allowed storm systems to move much farther south. By mid-February, a blocking pattern developed across the entire northern hemisphere, in effect keeping storm systems from moving much. In the Pacific, this pattern took on the form of what is called a "rex-block" with high pressure locked into place south of Alaska and low pressure in a position just west of Hawaii, and was very similar to the atmospheric pattern which persisted during March 1951 which held some rainfall records that were broken in this event. This year's blocking pattern was also responsible for the repeated storms impacting much of California.


Normally during March, Hawaii will see several strong trade wind events and shear line passages with considerable rainfall over the windward, or north- and east-facing, slopes of the islands. Instead, March 2006 brought only 5 days of low level winds from a trade direction with the remainder being from the southeast through southwest due to the persistent pattern of low pressure to our west. It was not a single low that persisted for nearly 7 weeks, but rather a series. A particular low would last for a few days and weaken and then give way to a developing new low as a shortwave would drop into the persistent upper level trough and provide additional energy to the system and creating another "Kona Storm". When this occurred, strong southwest winds aloft would extend as far south as 5 degrees north latitude, tap into the deep tropical moisture and transport it over the state. This moisture, combined with the instability in the atmosphere would produce another round of thunderstorms and heavy rains.


There were many discrete systems which resulted in all of the weather experienced across Hawaii. The episodes were:

  1. February 19-21. Relatively weak kona low northwest of Kauai resulted in thunderstorms around Kauai and Oahu. Flash flooding on portions of Kauai and Oahu. Several homes sustained damage near the town of Koloa as a result of flood waters from Waikomo Stream. Taro fields were also inundated by an overflowing Hanalei River and landslides blocked portions of Kuhio Highway near Kalihiwai. Heavy rains on Oahu caused urban flooding near the Middle Street ramp on the H-1 freeway and in the low-lying Mapunapuna business district. A home in Kaaawa also sustained flood damage as heavy rains shifted toward the northeast from Honolulu. No significant flood-related injuries were reported. Significant damage to the Hanalei taro crop occurred but damage estimates were not available.
  2. March 1-3. Strong kona low developed near the International Dateline and induced southeast low level flow over the island chain. The interaction of the low level southeasterlies with the Koolau Range on Oahu produced moderate to heavy rain. Severe flooding occurred over the east-facing slopes of the Koolaus with significant damage in the Kaaawa, Hauula, and Punaluu areas. A gage at Punaluu recorded 22.47 inches over the 2-day period. Heavy rains also occurred on Kauai but did not cause any immediate problems.
  3. March 8-11. Renewed intensification of the low pressure system west of the state. Low level flow once again veered to a more southeasterly direction coincident with an increase in upper level instability. These conditions set the stage for the development of a strong thunderstorm over the windward Koolaus on the evening of March 8. The storm anchored over the Hauula and Punaluu areas and produced radar estimated rain totals of more than 4 to 6 inches in a 3-hour period. Flash flooding occurred in Maakua Stream and severe inundation once again impacted communities from Laie to Kahana. Other islands were not spared by the March 8 onslaught with as much as 14 inches of rain over north Kauai forcing the closure of Kuhio Highway at the Hanalei Bridge for the second time in 24-hours and 6 to 10+ inches of rain falling over the southeast-facing slopes of the Big Island causing numerous road closures in Hilo. 8 to 12 inches of rain occurred over portions of north and east Kauai during the period from March 9 through 12. Mount Waialeale recorded over 28 inches during this 4-day period with 3 to 6 inches falling over south- and west-facing slopes. The Kauai Marriott Resort suffered significant damage due to the overflow of Keonaawanui Stream during the early morning hours of March 11.
  4. March 13-18. Kona Storm #4. The focus was primarily on Kauai as convergent southeasterly and southerly low level flow promoted the development of thunderstorms and heavy rains across the island. The most notable event during this period was the failure of Ka Loko Dam in northeast Kauai during the early morning of March 14. The wall of water swept away homes and structures and resulted in 3 confirmed deaths and 4 persons missing. Concern extended to other full or nearly full reservoirs, especially Waita Reservoir, Alexander Reservoir, Morita Reservoir, and Puukaele Reservoir. Repeated thunderstorms and heavy rains produced numerous road closures from flooding and inundated many properties.
  5. March 19. A strong shortwave embedded within the upper level trough swept across the state. This system hit Oahu hardest with strong thunderstorms dumping 3 to 5 inches of rain, mostly in a 6-hour period between 8 AM and 2 PM. Several properties were inundated in west Oahu and, once again, along the north- and east-facing slopes of the Koolaus. The Big Island also saw 3 to 5 inches of rain that forced the closure of Highway 11 near Kawa Flats in Kau.
  6. March 21-25. Several more shortwaves. This latest round of unpleasant weather featured strong dynamics and instability, very similar to those found in the midwestern U.S. during tornado season. On March 21, a thunderstorm near Kaneohe Bay, Oahu produced a large waterspout. Then on March 23, a supercell with a hook echo (reflectivityvelocity) developed southwest of Lanai late in the evening prompting a tornado warning for the island. Shortly thereafter, a tornado moved onshore at Kaumalapau Harbor at about 9:35 PM HST and damaged several structures. This tornado was rated F0 on the Fujita Scale. Severe thunderstorms on March 24 on the Big Island produced quarter-size hail and gusty winds near 50 mph near Kealakekua during the morning (radar reflectivity and VIL 4-panel) and then again during the afternoon near Mountain View. A tornado, lasting about 10 minutes and also rated F0, occurred late in the afternoon on March 25 near Haiku, Maui in association with a small thunderstorm (reflectivityvelocitymapphoto1photo2). No damage was reported. Of course, heavy rains did continue with flash flood warnings issued daily from March 21 through 24. On the night of March 22, an area of thunderstorms moved over Honolulu from the southwest resulting in flash flooding in Maunalaha Stream in upper Makiki and forcing the evacuation of one family. Landslides also occurred on Round Top Drive in the Tantalus area. Thunderstorm activity shifted eastward and impacted Molokai on the morning of March 23. These storms dropped over 2 inches of rain within a 3-hour period and caused flood damage to a bakery in Kaunakakai. Another round of fast-moving thunderstorms swept over Honolulu and east Oahu during the evening of March 23 and caused considerable ponding in low lying areas such as Waikiki and another round of landslides in Tantalus. In a repeat performance, another round of strong, fast-moving thunderstorms hit Honolulu hard during the evening of March 24 with 1- to 2-inch per hour rains producing more Tantalus landslides and causing the overflow of Makiki Stream near Fern Street and Moku Place.
  7. March 26. Another strong upper level short wave. This shortwave brought more heavy rains and flash flooding primarily for Kauai, Oahu, Molokai, and Maui. An additional 2 to 6 inches of rain on Kauai caused further damage to the pier at Fern Grotto due to high water levels on Wailua River.
  8. March 27. Yet another strong upper level short wave. This shortwave ignited severe thunderstorms south of the islands early in the morning (5am radar mosaic). These thunderstorms organized into a bow echo and impacted Lanai and Maui during the morning (9am radar view10am radar view). Maui was hardest hit with winds in excess of 50 mph reported at Wailea. Trees and branches were reported blown down in Wailea and Kula. Haleakala National Park was closed for a time due to winds in excess of 70 mph and hail above the 7000 foot level. Shortly before noon, these thunderstorms moved across the northern part of the Big Island and pea size hail was repoted in Kameula by a Skywarn Spotter.
  9. March 30. Cut-off mid level low to the northwest and very strong upper level jet stream. Conditions were nearly perfect for additional severe thunderstorms on the morning of March 30. Strong low and mid level jets allowed the formation of supercells around Kauai and Oahu during the morning. Due to the threat of these damaging storms possibly moving onshore, a Severe Thunderstorm Watch was issued. Luckily the worst of the storms remained over the open ocean. Radar images (4 panelcross section) show the high reflectivity and structure of one of the storms in the Kauai Channel. Based upon radar data, this storm was likely producing a long lived and large waterspout as well as winds greater than 60 mph and hail at least 1 inch in diameter. One dissipating thunderstorm did move onshore the Waianae coast of Oahu and produced a 44 mph gust. During the late afternoon, another strong to severe thunderstorm developed into a bow echo formation and impacted Lanai with winds to 40 mph resulting in some downed tree branches.
  10. March 31-April 2. Continued cut-off mid level low to the northwest. This time, the worst impacts occurred on Oahu where strong thunderstorms moved over the eastern half of the island during the late morning of March 31. Several gages recorded 1 to 2 inches in 1 hour with the Waimanalo gage recording more than 3 inches in 2 hours. The heavy rains coupled with a very saturated ground produced severe runoff and flooding in several locations. Makiki Stream once again overflowed near Moku Place and inundated several blocks near Fern Street and Kalakaua Avenue. Manoa Stream overflowed at Woodlawn Drive prompting concern about a repeat performance of the October 2004 Manoa Flood and several upper Manoa properties suffered damage from severe levels of overland flow off the valley slopes. Farther east, storm runoff covered most of Kahala Mall�s ground level with water forcing its closure for several days. Kailua Reservoir, an abandoned structure in Waimanalo, filled rapidly as its relief structure was unable to keep up with the high levels of inflow. While the dam did not breach, several residents were evacuated as a precaution. And finally, as if to end with an exclamation point, the 6-week rain event ended with an April 2 finale of heavy rains along windward slopes of the Koolaus, along north and east Kauai, east Maui, and north and east Big Island. The Koolau rains involved more than 6 hours of thunderstorms from Kahuku to Waimanalo producing 4 to 9 inches. The Maunawili and Waimanalo areas were hardest hit with the old Kailua Reservoir rapidly filling for the second time in 3 days, once again prompting the evacuation of downstream residents as a precaution.


Satellite Imagery

Daily satellite image look demonstrating the rounds of systems impacting Hawaii. The reds in the satellite imagery indicate the colder cloud tops, which are typically thunderstorm clouds.

Daily Satellite Images


Hourly satellite animations from February 19 through April 2, 2006, courtesy Dr Steve Businger, University of Hawaii Meteorology Department. 
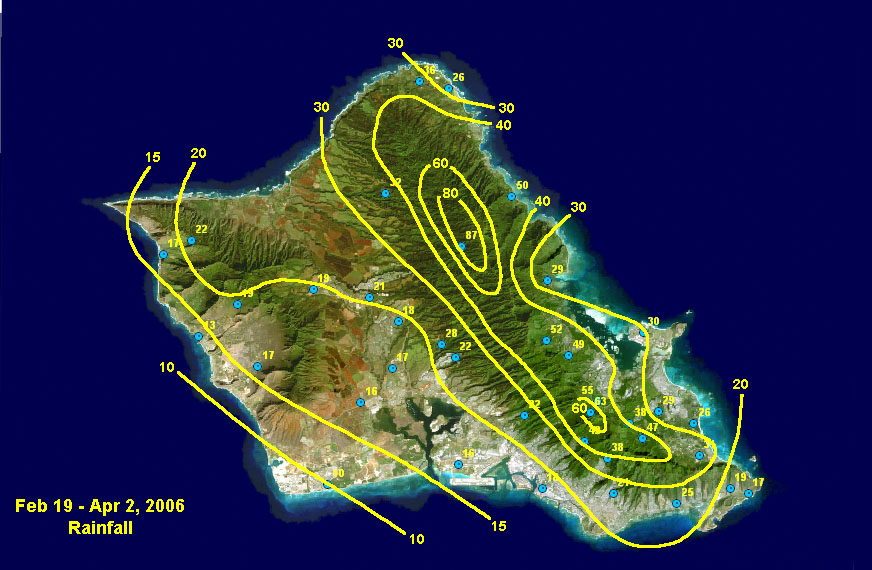
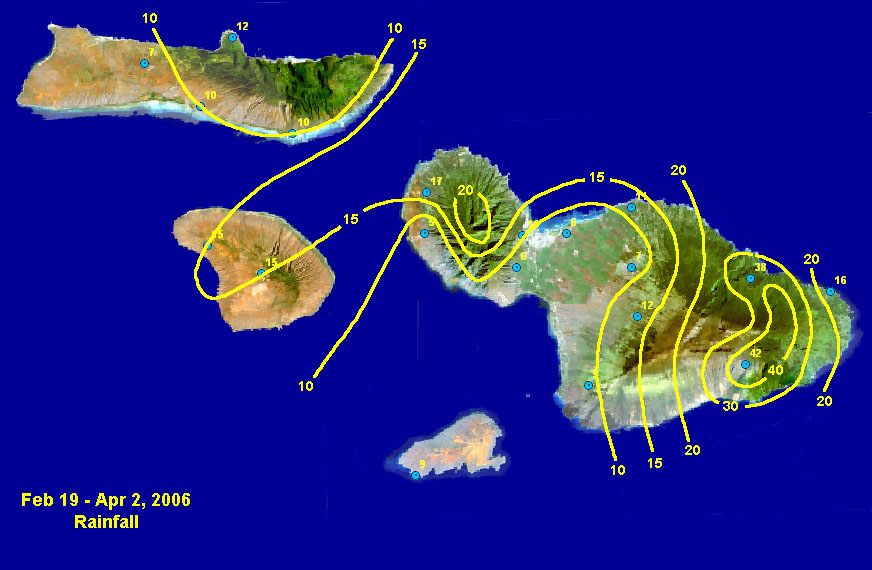
Infrared Imagery 

Water Vapor Imagery 


Rainfall Amounts:

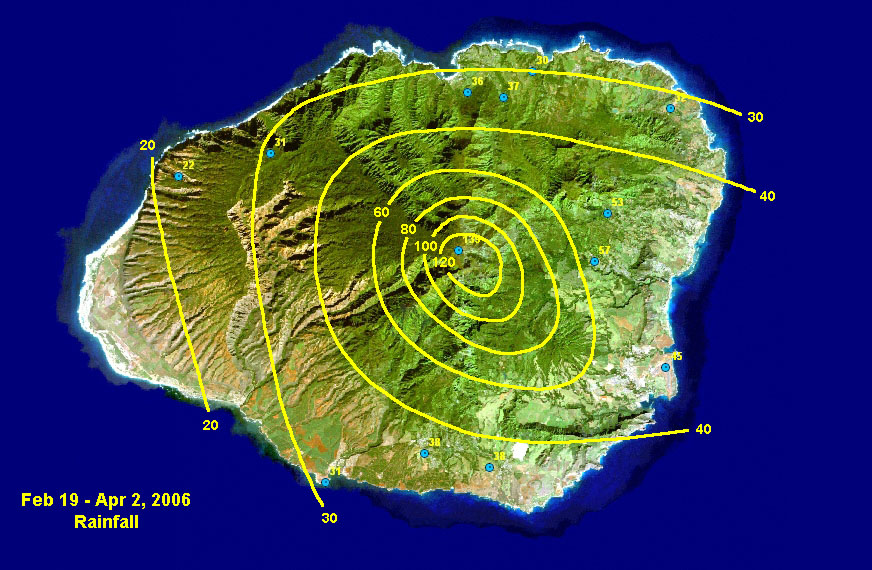
For the vast majority of the state, excessive rains fell. In some locations, such as Lihue, more than the normal yearly amount of rain occurred. Kauai, Oahu and southeast portions of Maui and the Big Island were hardest hit, although record setting rains were generally confined to Kauai and Oahu. One glaring exception was the northeast side of the Big Island. Persistent southerly wind flow resulted in Mauna Kea and Mauna Loa blocking much of the moisture from reaching that portion of the island, and as a result, rainfall totals were much below normal for the period. In addition to all the rainfall, the summits of Mauna Loa and Mauna Kea, especially above 12,000 feet endured numerous snow storms. It is estimated that 2 to 4 feet of snow fell during the period. On several occasions this snow was accompanied by strong winds resulting in snow drifts over 6 feet.


Maps: Kauai Oahu Molokai/Lanai/Maui Big Island of Hawaii


Note: These rainfall totals are considered provisional and are for information purposes only. These data have not been fully validated.


Kauai

Rain

Notes

MOUNT WAIALEALE

138.79

March (94.30") was second wettest behind March '82 (148")

WAILUA

57.09


KAPAHI

53.20


HANALEI RIVER

53.07


LIHUE AIRPORT

45.33

March was the wettest monthever (36.13"). Previous was 22.91" in Dec 1968.

OMAO

38.30


HANALEI

37.63


MOLOAA

31.97

Wettest March on record (30.52")

KOKEE

31.71


PORT ALLEN

31.47


PRINCEVILLE AIRPORT

30.08


KALAHEO

29.70


MAKAHA RIDGE

22.34


Oahu


POAMOHO 2

87.18


WILSON TUNNEL

62.69


LULUKU

55.47


WAIHEE PUMP

52.60


PUNALUU PUMP

50.00

Wettest March on record (40.31")

AHUIMANU LOOP

49.38


MAUNAWILI

47.07


NUUANU UPPER

42.98


ST. STEPHENS

38.79


MANOA - LYON ARBORETUM

37.69


KAHUKU

36.13


KAWAILOA

31.80


WAIMANALO

31.08

Wettest March on Record (24.35")

KANEOHE MCBH

29.94


HAKIPUU MAUKA

29.16


OLOMANA FIRE STATION

28.87


WAIAWA C.F.

28.22


BELLOWS AFS

26.52


KII

26.47


NIU VALLEY

24.66


PALISADES

22.59


MAKUA RIDGE

22.58


MOANALUA

21.94


WHEELER AIRFIELD

21.03


PALOLO FIRE STATION

20.85


SCHOFIELD BARRACKS

19.53


KAMEHAME

19.34


WAIANAE VALLEY

19.04


ALOHA TOWER

18.22


MILILANI

17.65


LUALUALEI

16.95


HAWAII KAI GOLF COURSE

16.78


WAIPIO

16.67


KUNIA

16.53


HONOLULU AIRPORT

16.26


WAIANAE

16.22


WAIANAE BOAT HARBOR

13.20


MAKUA RANGE

12.92


KALAELOA AIRPORT

10.05


Molokai


MAKAPULAPAI

12.07


KAMALO

9.91


KAUNAKAKAI MAUKA

9.72


MOLOKAI AIRPORT

6.60


Lanai


LANAI CITY

14.93


Kahoolawe


HONOKANAIA

8.55


Maui


KAUPO GAP

41.93


WEST WAILUAIKI

38.15


MAHINAHINA

16.49


HANA AIRPORT

16.27


KULA

11.58


HAIKU

10.93


WAILUKU

9.91


ULUPALAKUA

8.65


PUKALANI

7.14


WAIKAPU COUNTRY CLUB

5.91


KAHULUI AIRPORT

5.77


LAHAINALUNA

5.56


Big Island


GLENWOOD

54.72


WAIAKEA UKA

54.50


MOUNTAIN VIEW

51.77


PIIHONUA

47.28


HILO AIRPORT

34.00


PAHALA

31.12

Wettest March on record (31.01")

KAPAPALA RANCH

30.16


VOLCANO N.P - HILINA PALI

28.82


PAHOA

28.77


LAUPAHOEHOE

24.28


HAKALAU

22.18


SOUTH POINT

11.08


HONAUNAU

9.21


HONOKAA

7.89


KEALAKEKUA

7.01


PUU WAAWAA

6.80


UPOLU AIRPORT

6.13


KAHUKU RANCH

5.25


PUUANAHULU

5.15


POHAKULOA KIPUKA ALALA

4.89


KAMUELA UPPER

4.78


KAHUA RANCH

4.64


POHAKULOA WEST

4.54


WAIAHA

4.37


KAMUELA

3.83


Watch/Warning/Advisory Summary


From February 19 through April 2, the National Weather Service Forecast Office in Honolulu issued over 500 non-routine products providing important information to people in Hawaii about imminent or ongoing severe weather. These products included:


111 Flash Flood Warnings (means flooding is likely to occur within the next hour or already occurring). Flash Flood Warnings were issued on 26 days through the period. Typically there are 2 to 3 flash flood events each year during this same time period across the state. Our average lead time before flooding actually began was over 70 minutes.


88 Special Marine Warnings (for waterspouts and/or strong thunderstorms over the water within 40 miles of land that are capable of producing winds greater than 40 mph or large hail). Normally we issue about 30 special marine warnings in a year.


11 Severe Thunderstorm Warnings (means severe thunderstorms will likely occur within the next 30-60 minutes). Normally we have 2 to 4 severe thunderstorm events statewide each year.


5 Winter Weather Advisories (means snowfall of 2 to 5 inches is likely in the next 24 hours)


3 Severe Thunderstorm Watches (means severe thunderstorms with winds above 58 mph and/or large hail are possible within 6 hours) on Feb 19, March 24, March 30. Normally the office issues 1 to 2 watches a year.


2 Winter Storm Watches (means snowfall of 6 inches or more is possible in the next 36 hours).


2 High Wind Warnings (means sustained winds above 40 mph and/or gusts above 60 mph) for the upper summits of Mauna Kea and Mauna Loa. Strong winds are a fairly common event on the summits, especially during the winter.


1 Winter Storm Warning (means snowfall of 6 inches or more is likely in the next 24 hours).


1 Tornado Warning (means a tornado is likely within the next 30 minutes). Normally there are 1 or 2 tornadoes each year somewhere in Hawaii.


Flash Flood Watches (means flooding possible within the next 36 hours) were in effect for the following periods of time:

  1. February 19-22
  2. March 1-3
  3. March 8-11
  4. March 13-19
  5. March 21- April 2