What a difference a year makes. Spring 2012 was the warmest in recorded history for many individual locations in the area, as well as for the Midwest Region as a whole. In stark contrast, Spring 2013 has gone into the record books among the Top 10 coldest in history for many of those same locations. The image below, and the table which follows, detail the average temperatures for the Spring 2012 and Spring 2013 seasons for some of these locations, as well as the normal average temperature where available. The table also includes where 2013 ranks among the coldest Spring seasons on record.
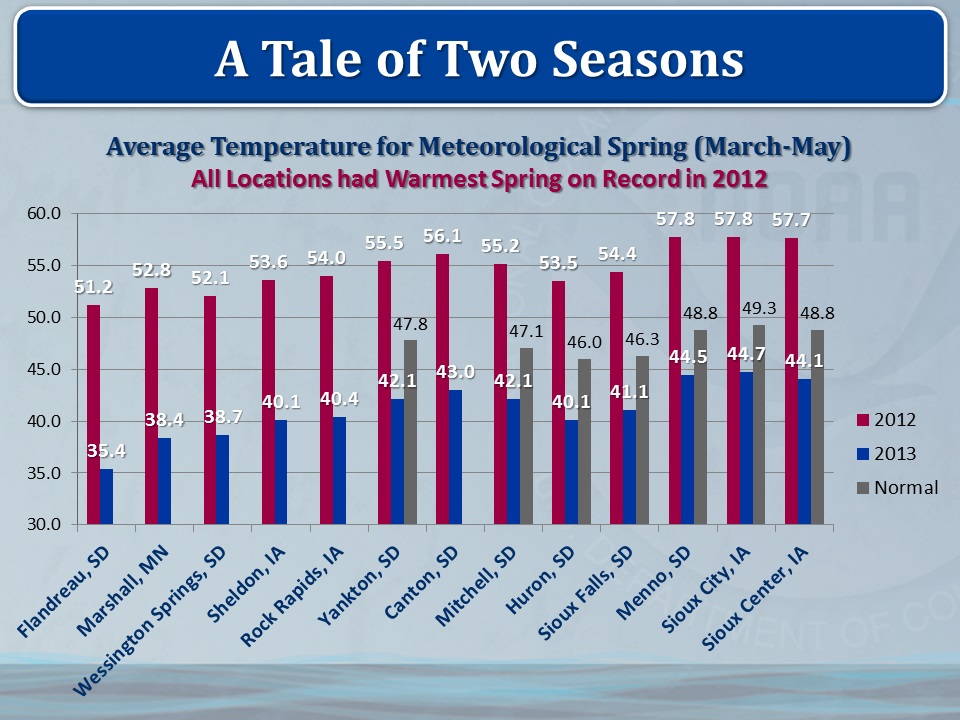
Average Temperature for Meteorological Spring (March-May) |
||||||
Location |
2012 Average |
2012 Rank Among Warmest |
2013 Average |
2013 Rank Among Coldest |
30 Year Normal (1981-2010) |
Notes |
| Flandreau, SD | 51.2 | 1 | 35.4 | 1 | 43.7* | missing 12 days in May 2009 |
| Marshall, MN | 52.8 | 1 | 38.4 | 1 | 45.7* | missing 1982 |
| Wessington Springs, SD | 52.1 | 1 | 38.7 | 1 | 46.8* | missing May 1982 & a few in 1981 |
| Sheldon, IA | 53.6 | 1 | 40.1 | 1 | 46.1* | missing 2 days in March 1988 |
| Rock Rapids, IA | 54.0 | 1 | 40.4 | 1 | 46.0* | missing various days |
| Yankton, SD | 55.5 | 1 | 42.1 | 4 | 47.8 | |
| Canton, SD | 56.1 | 1 | 43.0 | 6 | 47.8* | missing 2003 through 2006 |
| Mitchell, SD | 55.2 | 1 | 42.1 | 7 | 47.1 | |
| Huron, SD | 53.5 | 1 | 40.1 | 8 | 46.0 | |
| Sioux Falls, SD | 54.4 | 1 | 41.1 | 8 | 46.3 | |
| Menno, SD | 57.8 | 1 | 44.5 | 11 | 48.8 | |
| Sioux City, IA | 57.8 | 1 | 44.7 | 12 | 49.3 | |
| Sioux Center, IA | 57.7 | 1 | 44.1 | 13 | 48.8 | |


 Weather Story
 Weather Map
 Local Radar
 Follow us on YouTube