October 2009 proved to be a month of cool and wet conditions across the area, slowing and stalling at times the fall harvest, interfering with yard work and end of year construction projects, hampering the fall sports season, and featuring the most cloudy days in Sioux Falls for any month since 2004. The following tables summarize some of the climatic information for the month.
Sioux City
|
Rank |
Precipitation (inches) |
Avg. Temperature (degrees F) |
Avg. Max Temp. (degrees F) |
|
1 |
5.70 (2009)* |
39.3 (1925) |
47.6 (1925) |
|
2 |
5.30 (1979) |
43.0 (1917) |
53.3 (2009) |
|
3 |
4.83 (1982) |
44.3 (2009) |
54.1 (1917) |
|
4 |
4.77 (1968) |
44.5 (2002) |
54.6 (2002) |
|
5 |
4.61 (2008) |
45.1 (1976) |
55.8 (1911,1919) |
* wettest October on record Snowfall was 1.8", which was 8th greatest for October. Greatest was 9.8" in 1991.
Sioux Falls
|
Rank |
Precipitation (inches) |
Avg. Temperature (degrees F) |
Avg. Max Temp. (degrees F) |
|
1 |
6.89 (1911) |
37.8 (1925) |
47.1 (1925) |
|
2 |
6.28 (1998) |
38.2 (1917) |
49.7 (2009) |
|
3 |
5.98 (2007) |
40.9 (2002) |
50.2 (1917) |
|
4 |
5.73 (1973) |
42.4 (2009) |
50.3 (2002) |
|
5 |
5.52 (2009) |
43.1 (1895) |
53.0 (1969) |
Snowfall was 3.5", which was 9th greatest for October. Greatest was 10.0" in 1991.
Huron
|
Rank |
Precipitation (inches) |
Avg. Temperature (degrees F) |
Avg. Max Temp. (degrees F) |
|
1 |
6.44 (1946) |
36.8 (1925) |
46.5 (1925) |
|
2 |
5.12 (1998) |
39.3 (1917) |
48.6 (2009) |
|
3 |
4.88 (2008) |
39.7 (2002) |
49.8 (2002) |
|
4 |
4.66 (1961) |
41.3 (2009) |
50.9 (1917) |
|
5 |
3.90 (2009) |
41.4 (1919) |
52.1 (1919) |
Snowfall was 2.6", which was 14th greatest for October. Greatest was 10.7" in 1995.


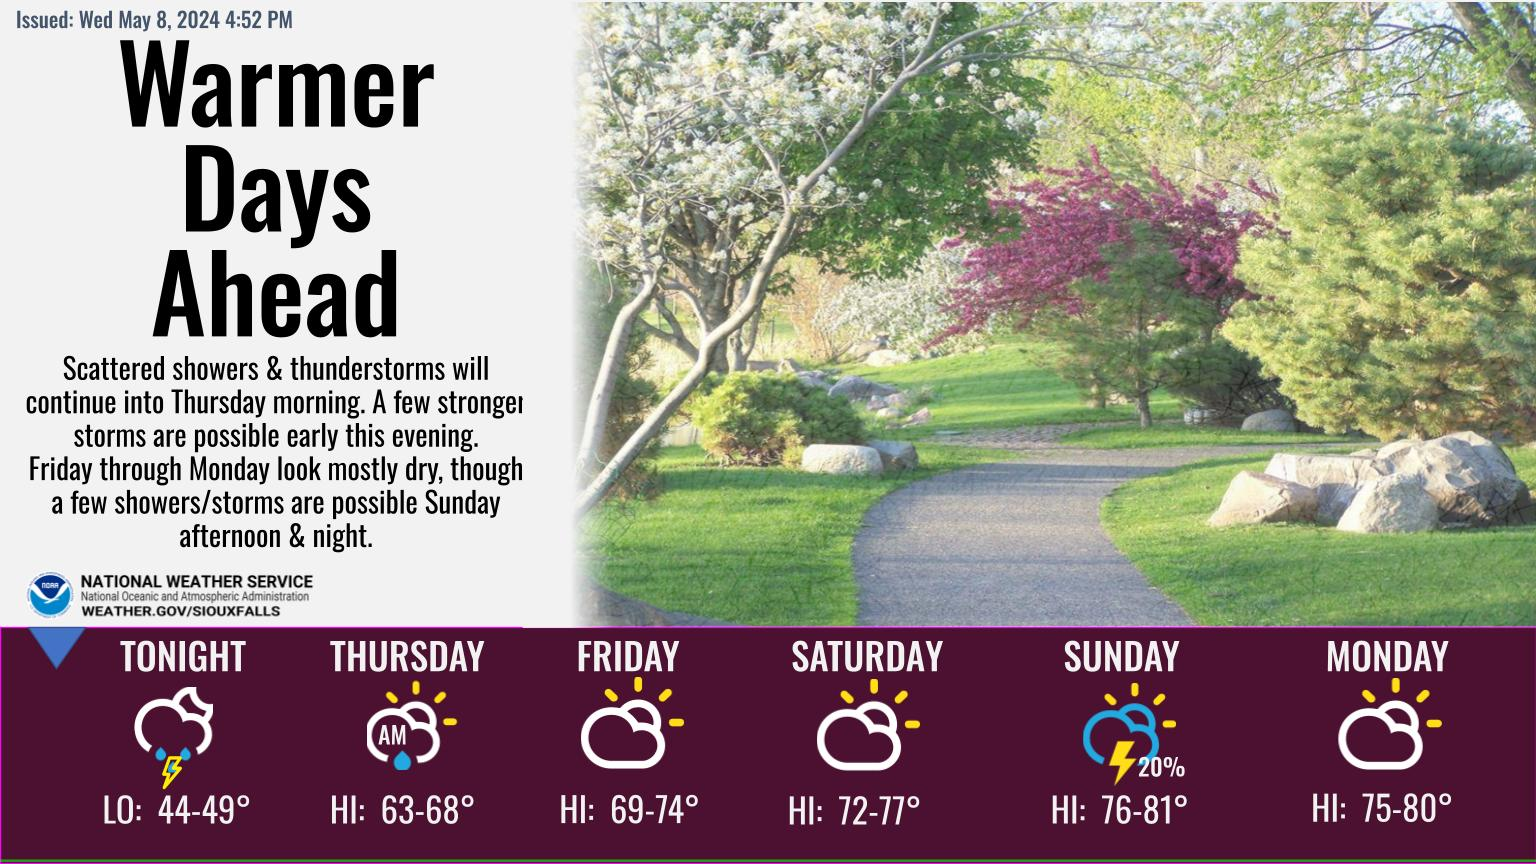 Weather Story
 Weather Map
 Local Radar
 Follow us on YouTube