 Hurricane Dolly made landfall approximately 80 miles south of Corpus Christi Texas on Wednesday July 23, 2008. Sustained tropical storm force winds spread as far north as the Corpus Christi Naval Air Station with tropical storm force wind gusts impacting nearly the entire Coastal Bend and Rio Grande Plains region. The peak wind gust measured in our county warning area was 63 MPH at the ASOS in Alice Texas. The winds peaked at approximately 60 mph along the barrier island as well from Bob Hall Pier down to Baffin Bay. The gusty winds caused sporadic power outages across the southern Coastal Bend and Rio Grande Plains primarily between Corpus Christi and Laredo. Only a few thousand customers were impacted.
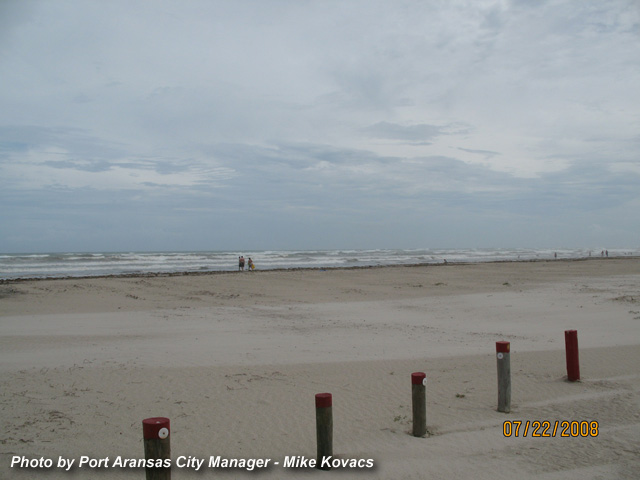
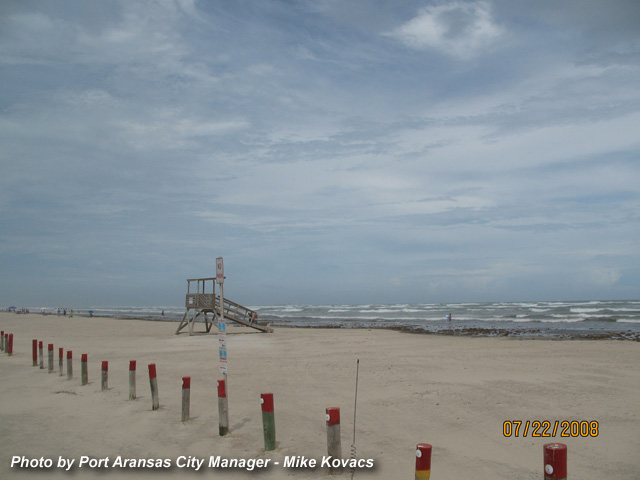
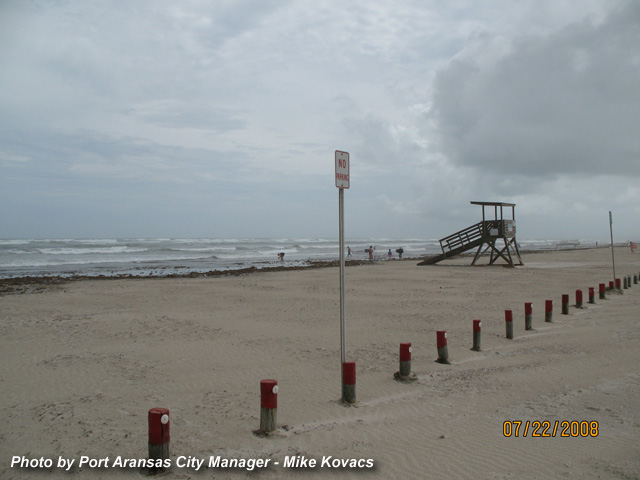
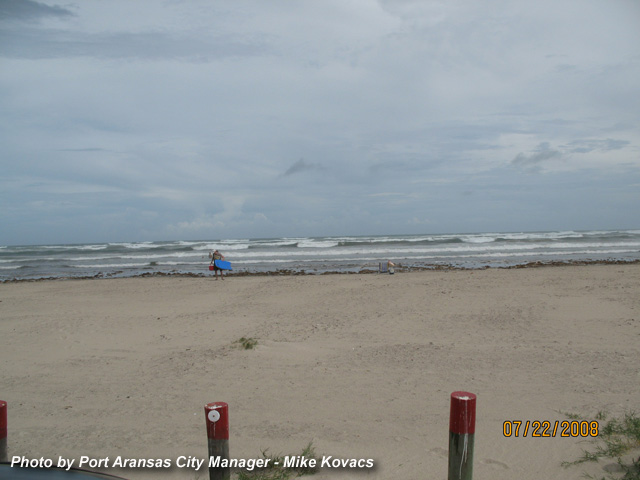
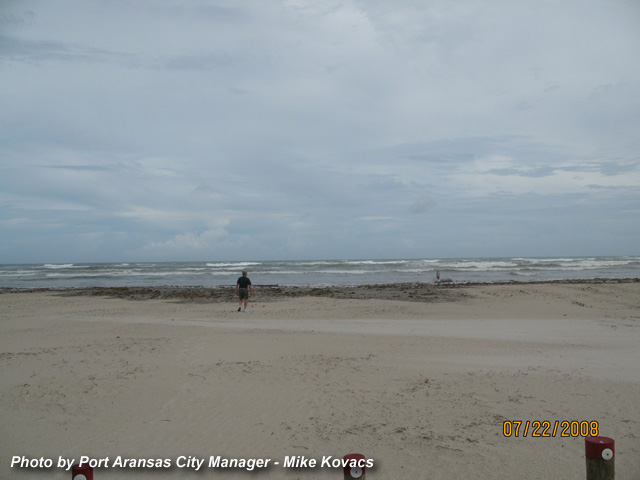
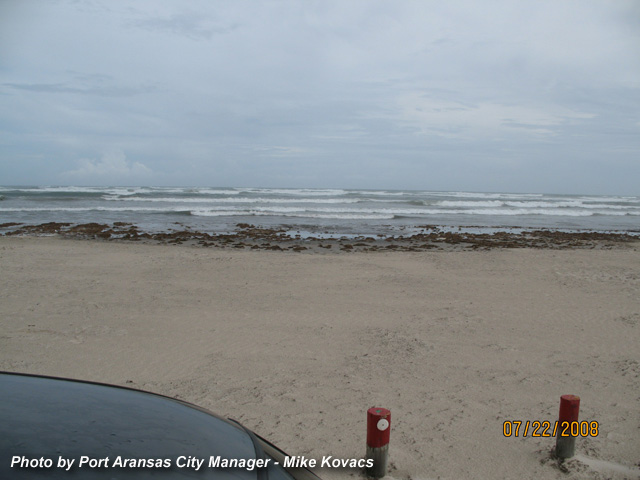
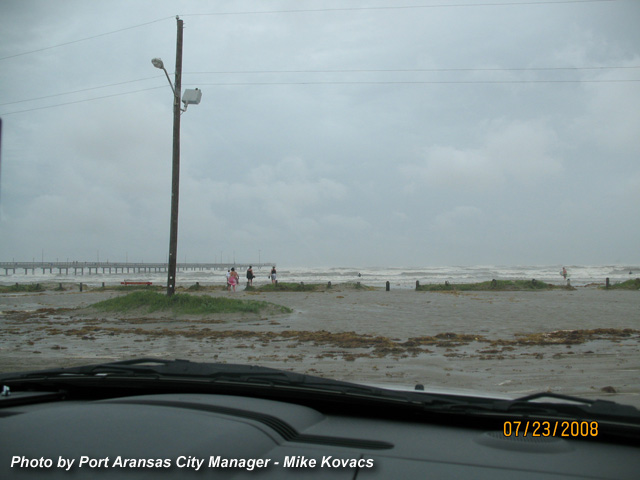
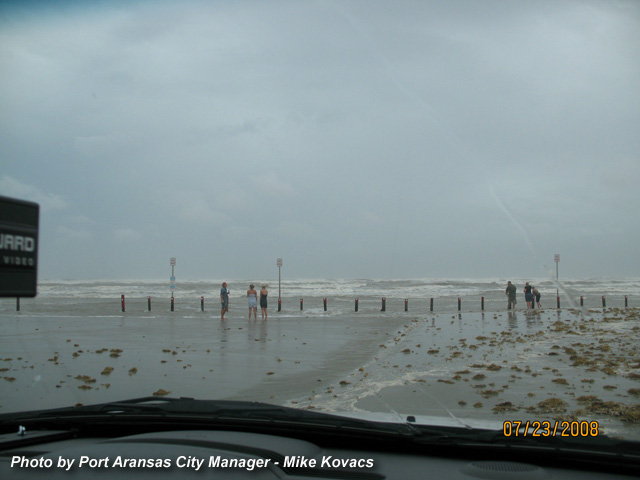
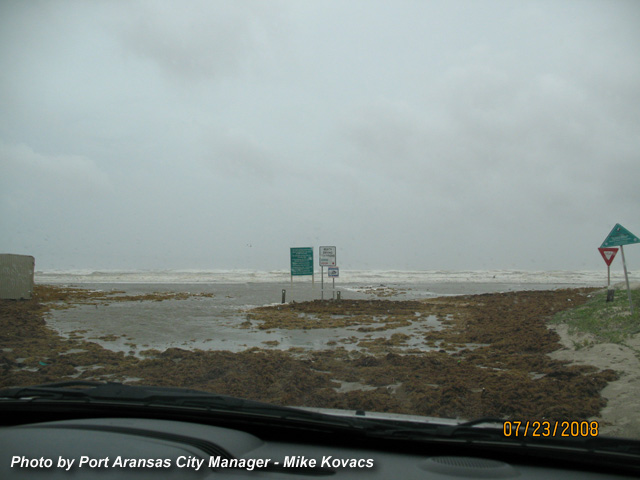
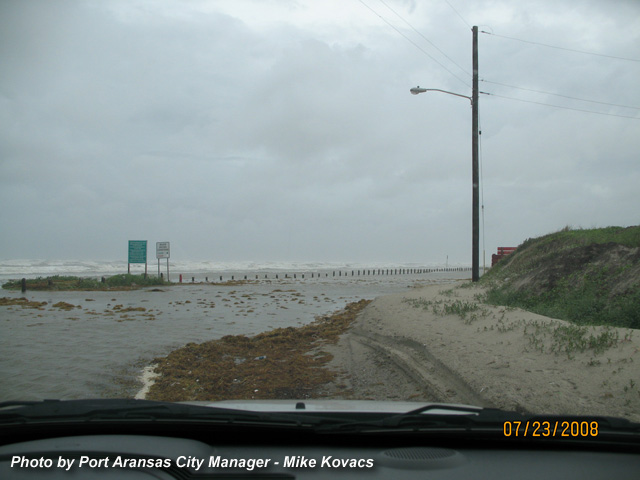
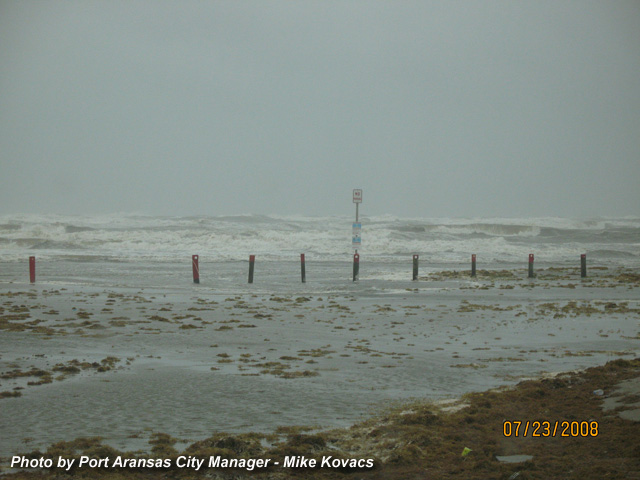
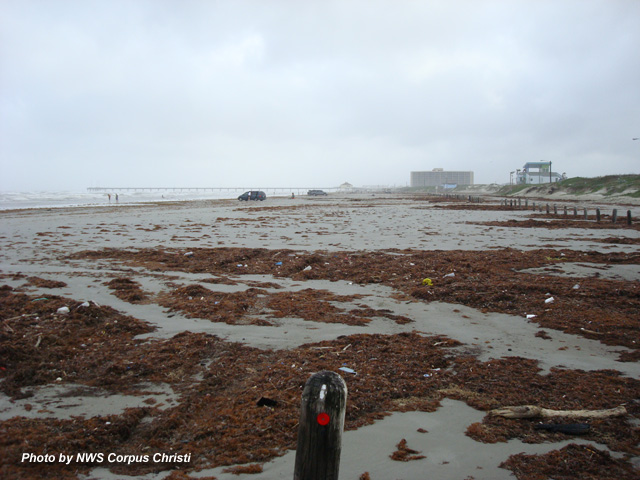
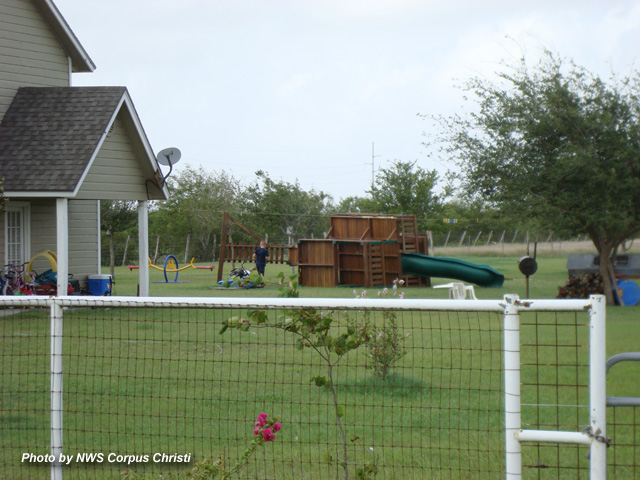
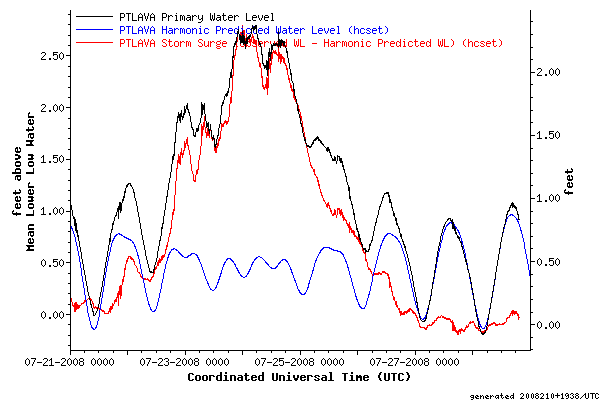
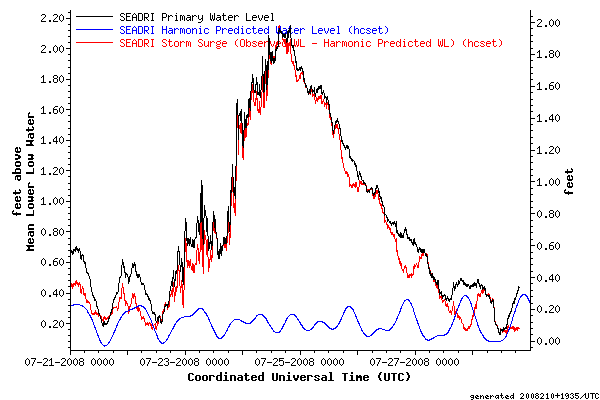
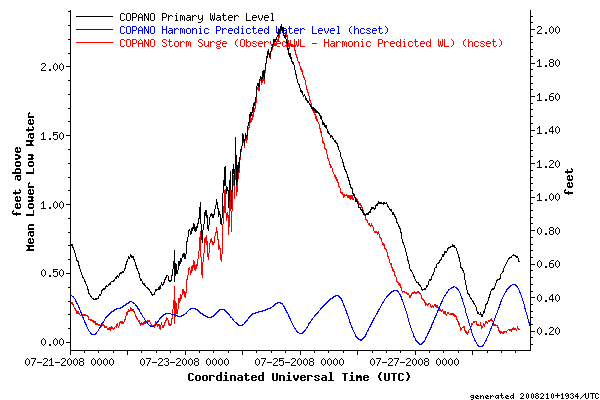
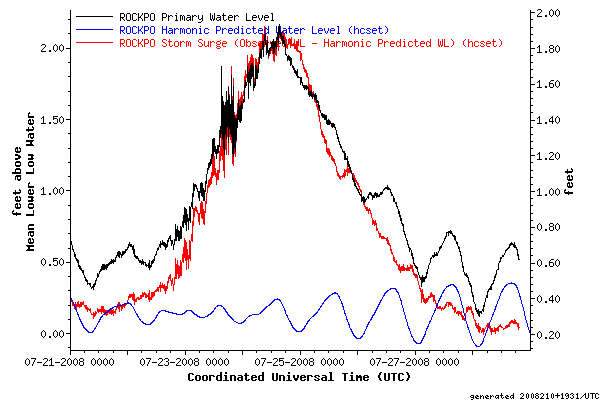
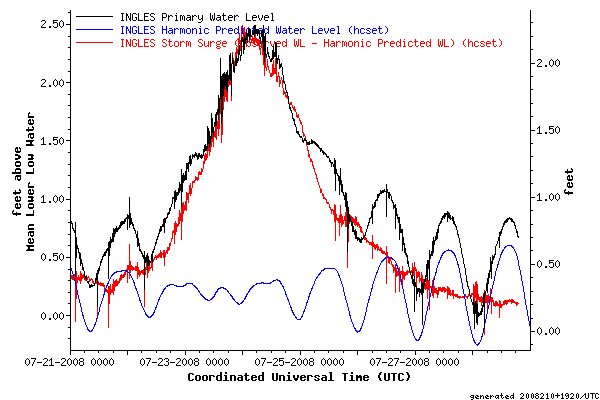
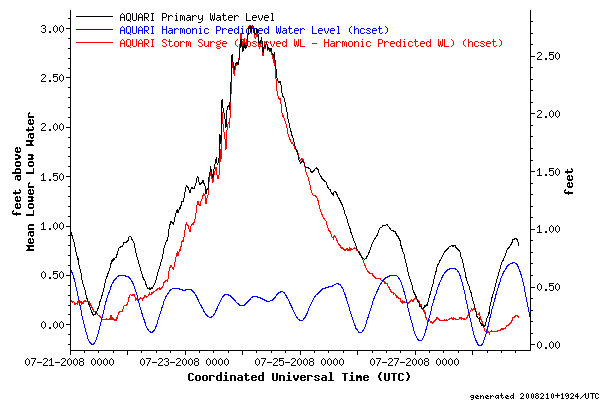
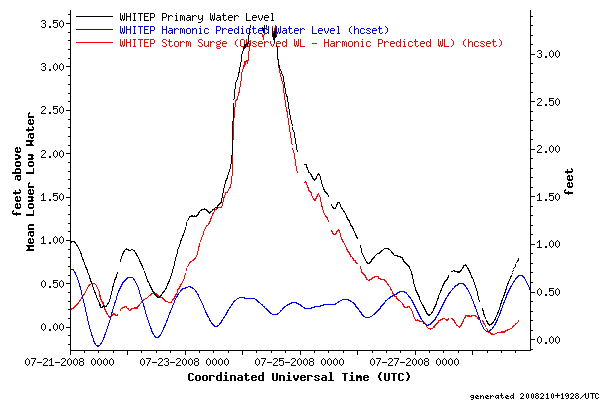
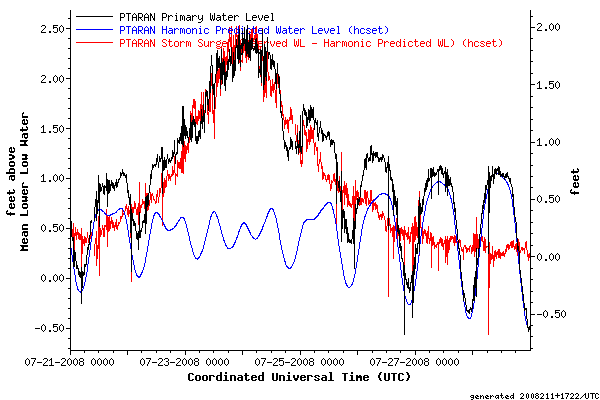
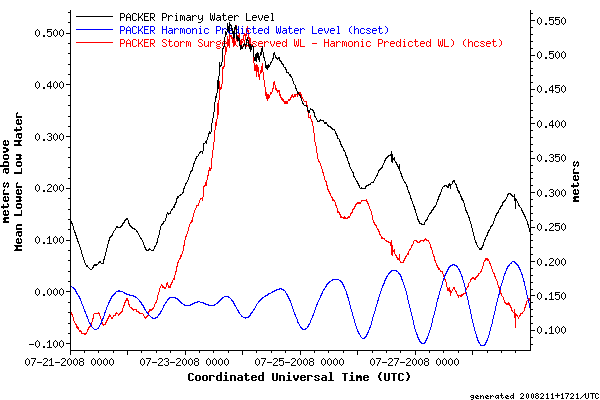
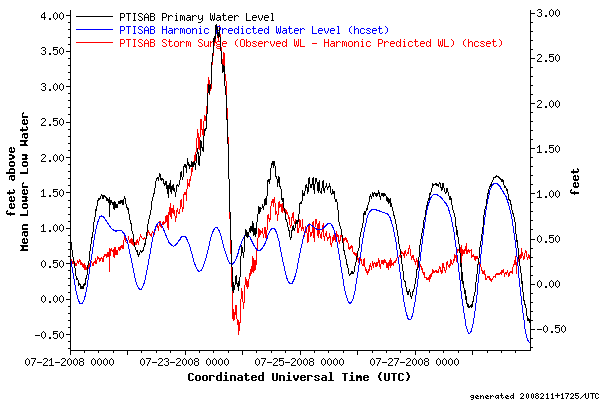
 Although the center of Dolly passed well to our south, her slow forward motion before landfall caused water levels to rise along the Mid Texas Coast. A storm surge of 2-3 feet MLLW was observed along the mid Coast and total storm tides approached 4 feet MLLW on North Padre Island shortly after the time of landfall Wednesday Evening. It is also interesting to note that total storm tides peaked at 3-3.5 Ft above MLLW in the back Bays including Nueces Bay and Lavaca Bay. At the time of this writing surge data was not available for Baffin Bay. You can view the damage Dolly caused by going to the Damage Photos tab atop the page.
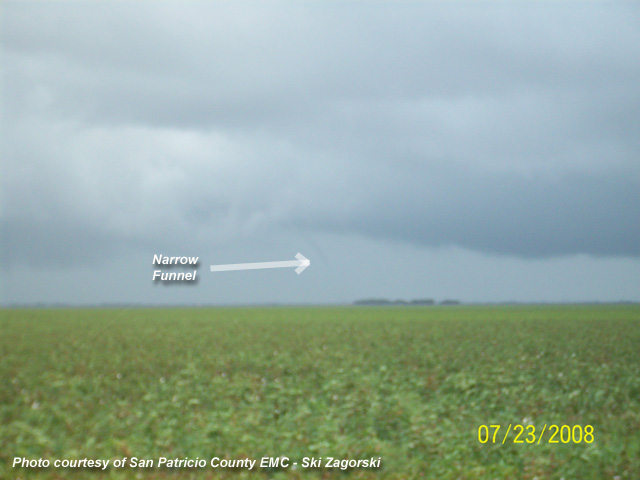
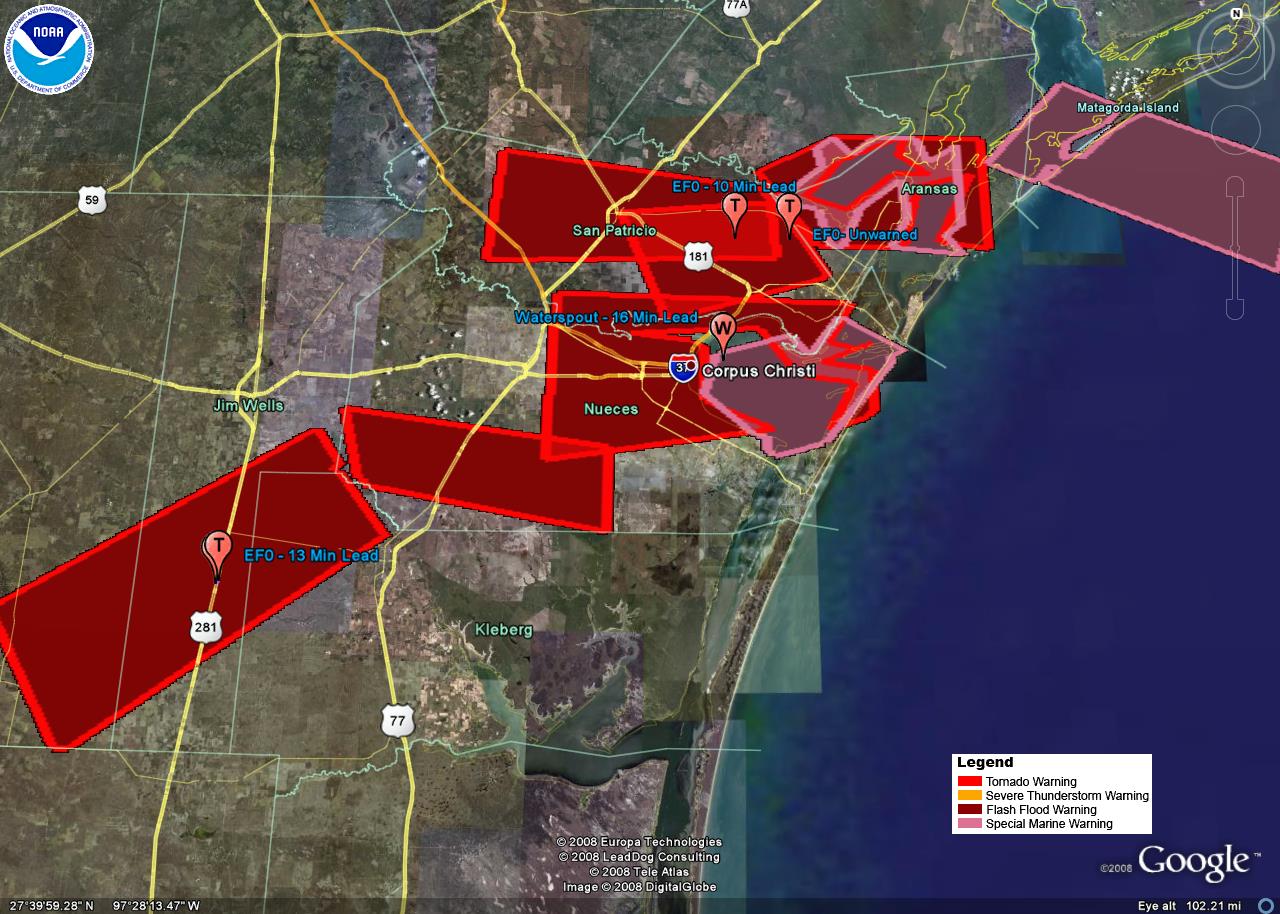 Tornadoes are common in Hurricanes and are generated in two areas: the eye wall region, and in the northeast quadrant of the hurricane, up to 250 miles northeast of the center. The National Weather Service in Corpus Christi issued 6 tornado warnings on the day of landfall. Warnings were issued for San Patricio, Nueces, Kleberg and Jim Wells Counties.
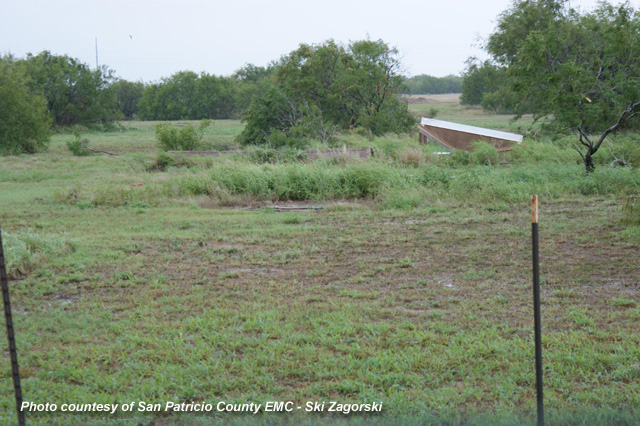
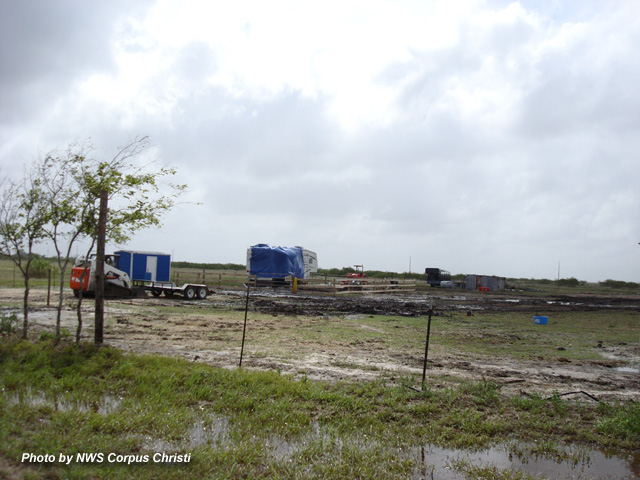
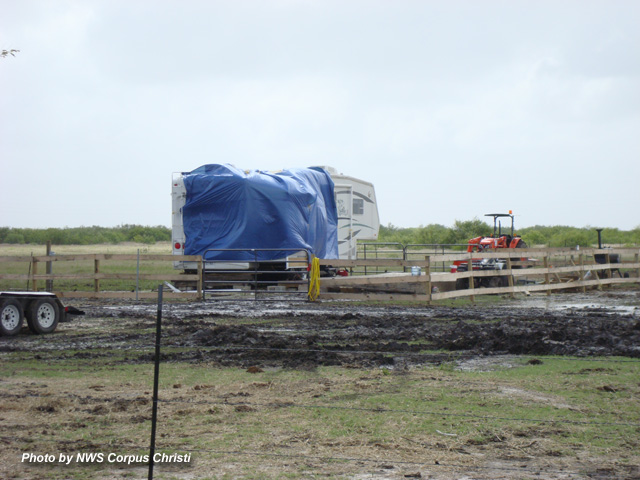
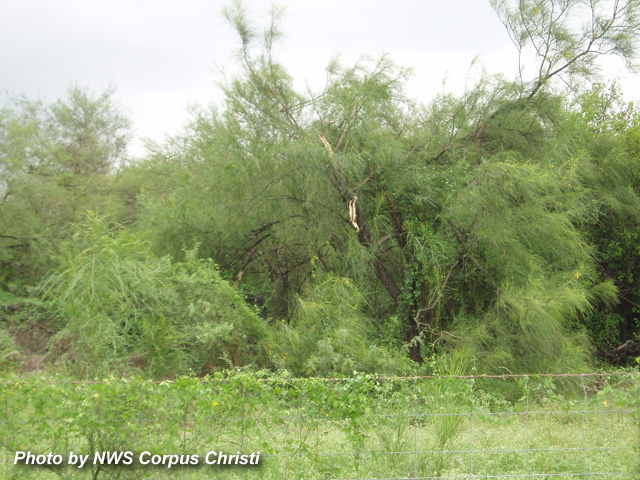
Isolated tornadoes occurred in the northeast quadrant including one waterspout and three tornadoes. Only minor damage was observed. The tornadoes were all rated EF-0. A Tornado Watch was posted from Tuesday Evening through Thursday Evening as strong wind shear, with helicity values in excess of 200 m2/s2, persisted. Tornado damage can also be seen in the Damage Photos tab
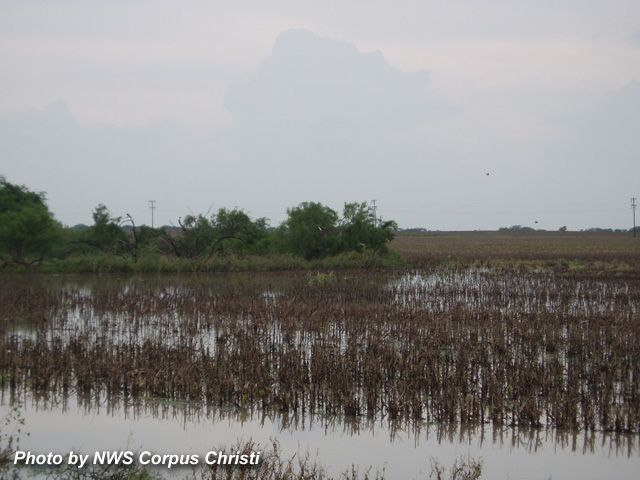
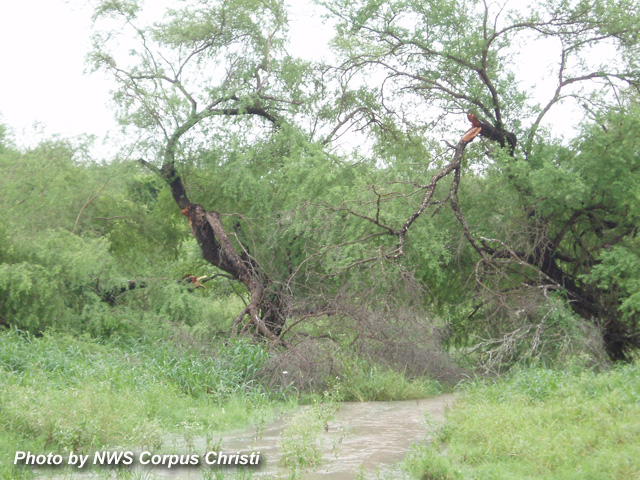
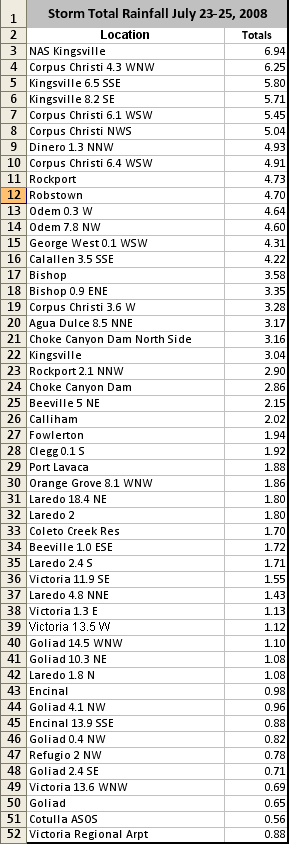
Dolly's slow movement produced torrential rainfall over the mid coast region and Rio Grande Plains. Rainfall totals of 1 to 2 inches were observed over northern portions of the region from Victoria to Laredo. 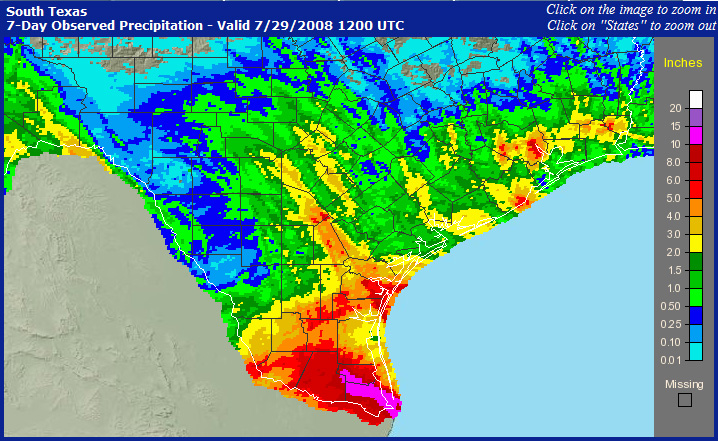 Totals of 3-6 inches; were observed generally south of a line from Rockport to Zapata. These heavy rains resulted in flooding of rural low lying roadways including FM 70 near Chapman Ranch in southern Nueces County, FM 628 and 1118 in Kleberg County. Minor street flooding was observed in Jim Wells and Duval Counties. The city of Laredo also experienced street flooding as the center of the circulation passed over the city. The heavy rains will have a negative impact on the farmer's ability to harvest the cotton crop. However the rains did end a severe drought which plagued the south Texas region for much of this year.
Dolly marks the forth hurricane to make landfall in Texas this decade. Hurricane Umberto made landfall near High Island Texas in 2007. Hurricane Rita hit southeast Texas in 2005 and Hurricane Claudette made landfall near Port O'Connor in 2003.
There were no deaths or injuries reported in the mid coast region from Dolly.
Radar Loop of Category 2 Hurricane Dolly |
|---|
 |
4 Panel Velocity Loop |
 |
Satellite Loop of Category 2 Hurricane Dolly Landfall
Image courtesy of Cooperative Institute for Meteorological Satellite Studies - UW Madison
Satellite Loop of Category 2 Hurricane Dolly |
|---|
 |
Other Satellite Photos of Hurricane Dolly |
 |
 |
| Weather Map of 250 MB Level - 12z July 23, 2008 (7am CDT) | Weather Map of 250 MB Level - 00z July 24, 2008 (7pm CDT) |
|---|---|
 |
 |
| Weather Map of 250 MB Level - 12z July 24, 2008 (7am CDT) | Weather Map of 250 MB Level - 00z July 25, 2008 (7pm CDT) |
 |
 |
| Weather Map of 250 MB Level - 12z July 25, 2008 (7am CDT) | |
 |
|
| Weather Map of 500 MB Level - 12z July 23, 2008 (7am CDT) | Weather Map of 500 MB Level - 00z July 24, 2008 (7pm CDT) |
 |
 |
| Weather Map of 500 MB Level - 12z July 24, 2008 (7am CDT) | Weather Map of 500 MB Level - 00z July 25, 2008 (7pm CDT) |
 |
 |
| Weather Map of 500 MB Level - 12z July 25, 2008 (7am CDT) | |
 |
|
| Weather Map of 700 MB Level - 12z July 23, 2008 (7am CDT) | Weather Map of 700 MB Level - 00z July 24, 2008 (7pm CDT) |
 |
 |
| Weather Map of 700 MB Level - 12z July 24, 2008 (7am CDT) | Weather Map of 700 MB Level - 00z July 25, 2008 (7pm CDT) |
 |
 |
| Weather Map of 700 MB Level - 12z July 25, 2008 (7am CDT) | |
 |
|
| Weather Map of 850 MB Level - 12z July 23, 2008 (7am CDT) | Weather Map of 850 MB Level - 00z July 24, 2008 (7pm CDT) |
 |
 |
| Weather Map of 850 MB Level - 12z July 24, 2008 (7am CDT) | Weather Map of 850 MB Level - 00z July 25, 2008 (7pm CDT) |
 |
 |
| Weather Map of 850 MB Level - 12z July 25, 2008 (7am CDT) | |
 |
|
| Weather Map of 925 MB Level - 12z July 23, 2008 (7am CDT) | Weather Map of 925 MB Level - 00z July 24, 2008 (7pm CDT) |
 |
 |
| Weather Map of 925 MB Level - 12z July 24, 2008 (7am CDT) | Weather Map of 925 MB Level - 00z July 25, 2008 (7pm CDT) |
 |
 |
| Weather Map of 925 MB Level - 12z July 25, 2008 (7am CDT) | |
 |
|
| Surface Map - 12z July 23, 2008 (7am CDT) | Surface Map - 00z July 24, 2008 (7pm CDT) |
 |
 |
| 07/23/2008 00Z CRP Sounding | 07/23/2008 18z CRP Sounding |
 |
 |
| 07/24/2008 00Z CRP Sounding | 07/25/2008 00Z CRP Sounding |
 |
 |


 Follow us on YouTube